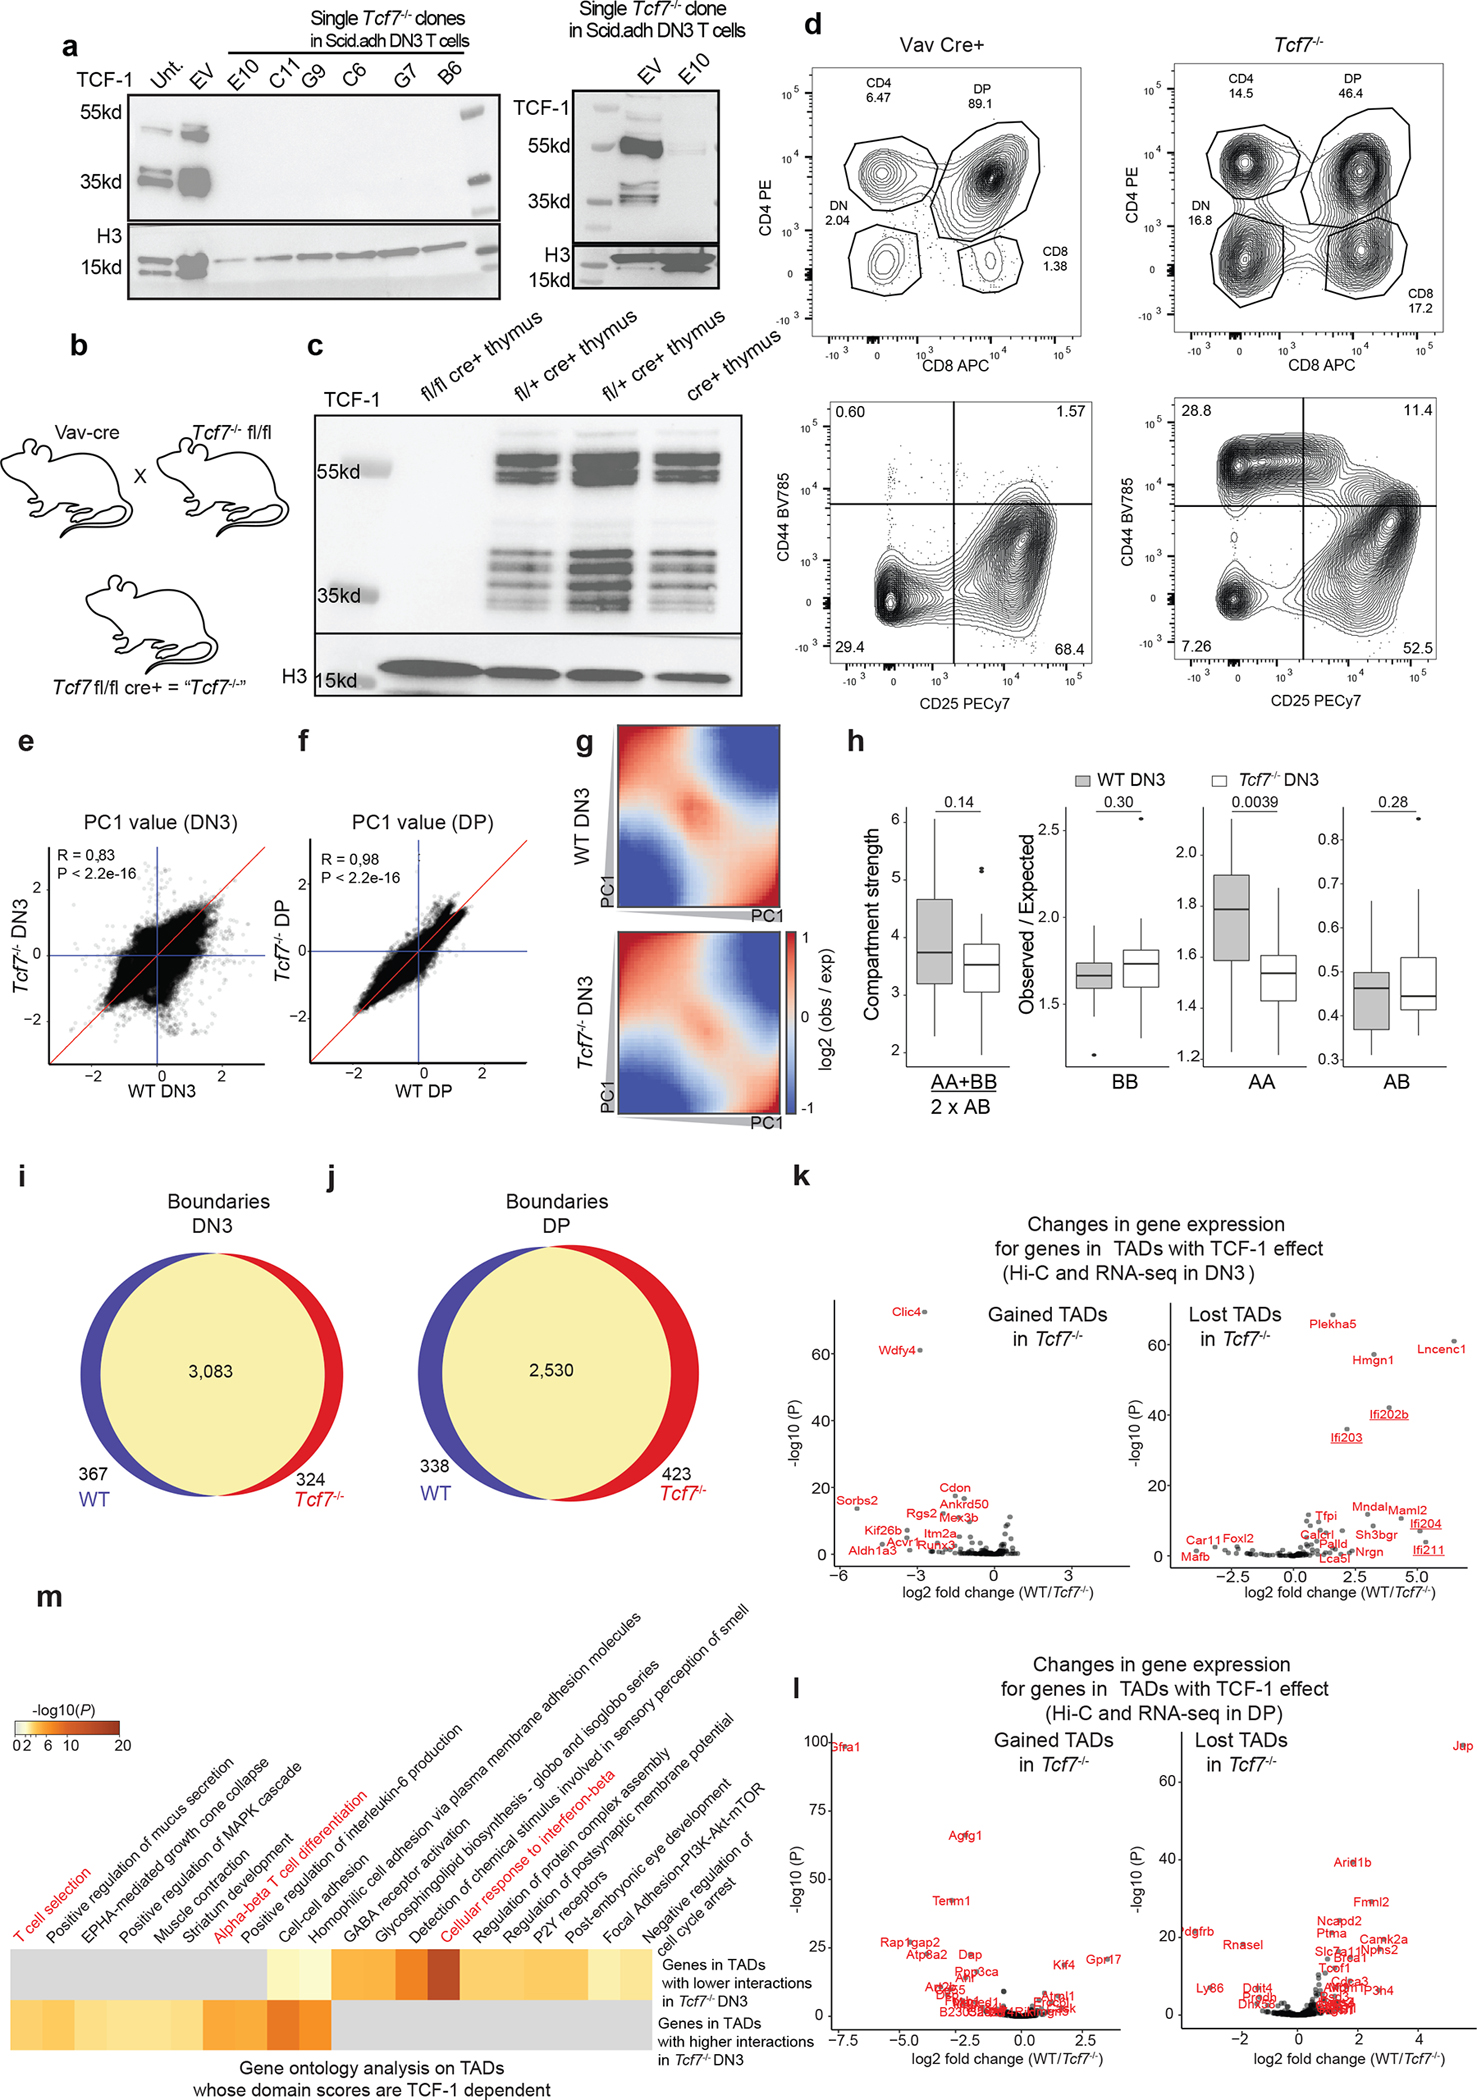
Extended Data Fig. 6. 3D genome reorganization after TCF-1 deletion in DN3 and DPs.

a. Western blot of TCF-1 in DN3s in which TCF-1 was disrupted using CRISPR/Cas9. Single cell clones in bold indicate those utilized for further experiments. Experiments were carried out twice and similar results were obtained.
b. Illustration of breeding strategy for disruption of Tcf7 in mice by crossing Vav-Cre with Tcf7 floxed mice, generating mice in which TCF-1 is conditionally ablated in all hematopoietic cells.
c-d. Western blot of TCF-1 in thymocytes from homozygous fl/fl cre+ (Tcf7−/−), heterozygous fl/+ cre+ (N=2), and cre+ mice. (c) Flow cytometric analysis of thymocytes from Vav cre+ control and Tcf7−/− experimental mice. Top panel shows CD4+ and CD8+ populations and is pre-gated on lymphocytes, live, and single cells. Bottom panel shows DN populations DN1-DN4 (upper left to lower left quadrant clockwise) as measured based on CD44 and CD25 expression and is pre-gated on lymphocytes, live, single cells and lineage negative cells (d).
e-f. Scatter plot showing A/B compartment distribution using correlation of PC1 values between wildtype and Tcf7−/− DN3s (e) and DPs (f). Blue lines are PC1 equals zero, and red line is where PC1 are equal in two conditions. Pearson correlation coefficients and P-values are shown.
g. Saddle plot shows the compartmentalization in wildtype and Tcf7−/− DN3s. The regions are sorted by PC1 value from B to A compartment, and interactions between different regions are shown in the heatmap. One Hi-C experiment was performed in the wildtype condition and two Hi-C experiments were performed in two distinct Tcf7−/− DN3 clones.
h. Data are shown as boxplots (centre, median; box limits, upper (75th) and lower (25th) percentiles; whiskers, 1.5× interquartile range; points, outliers) showing the compartment strength, BB interactions, AA interactions and AB interactions in wildtype and Tcf7−/− DN3s (n=20 mouse chromosomes). The statistical test was done using two-sided Student’s t-test. (ns: not significant, *: P< 0.05).
i-j. Venn diagram showing the unique and shared boundaries between wildtype and Tcf7−/− DN3s (i) and DP (j).
k-l. Scatter plot showing changes in gene expression located in the top 50 TADs that lost domain score in DN3 (k) and DP (l) T cells. Genes that were significantly (P < 0.05, abs(log2FoldChange) > 0.5) differentially expressed were shown in red. m. Gene-ontology analysis of genes in the top 50 TADs that gained domain score and the top 50 TADs that lost domain score after TCF-1 deletion in DN3s using metaScape. T cell-specific ontology terms are marked in red.
