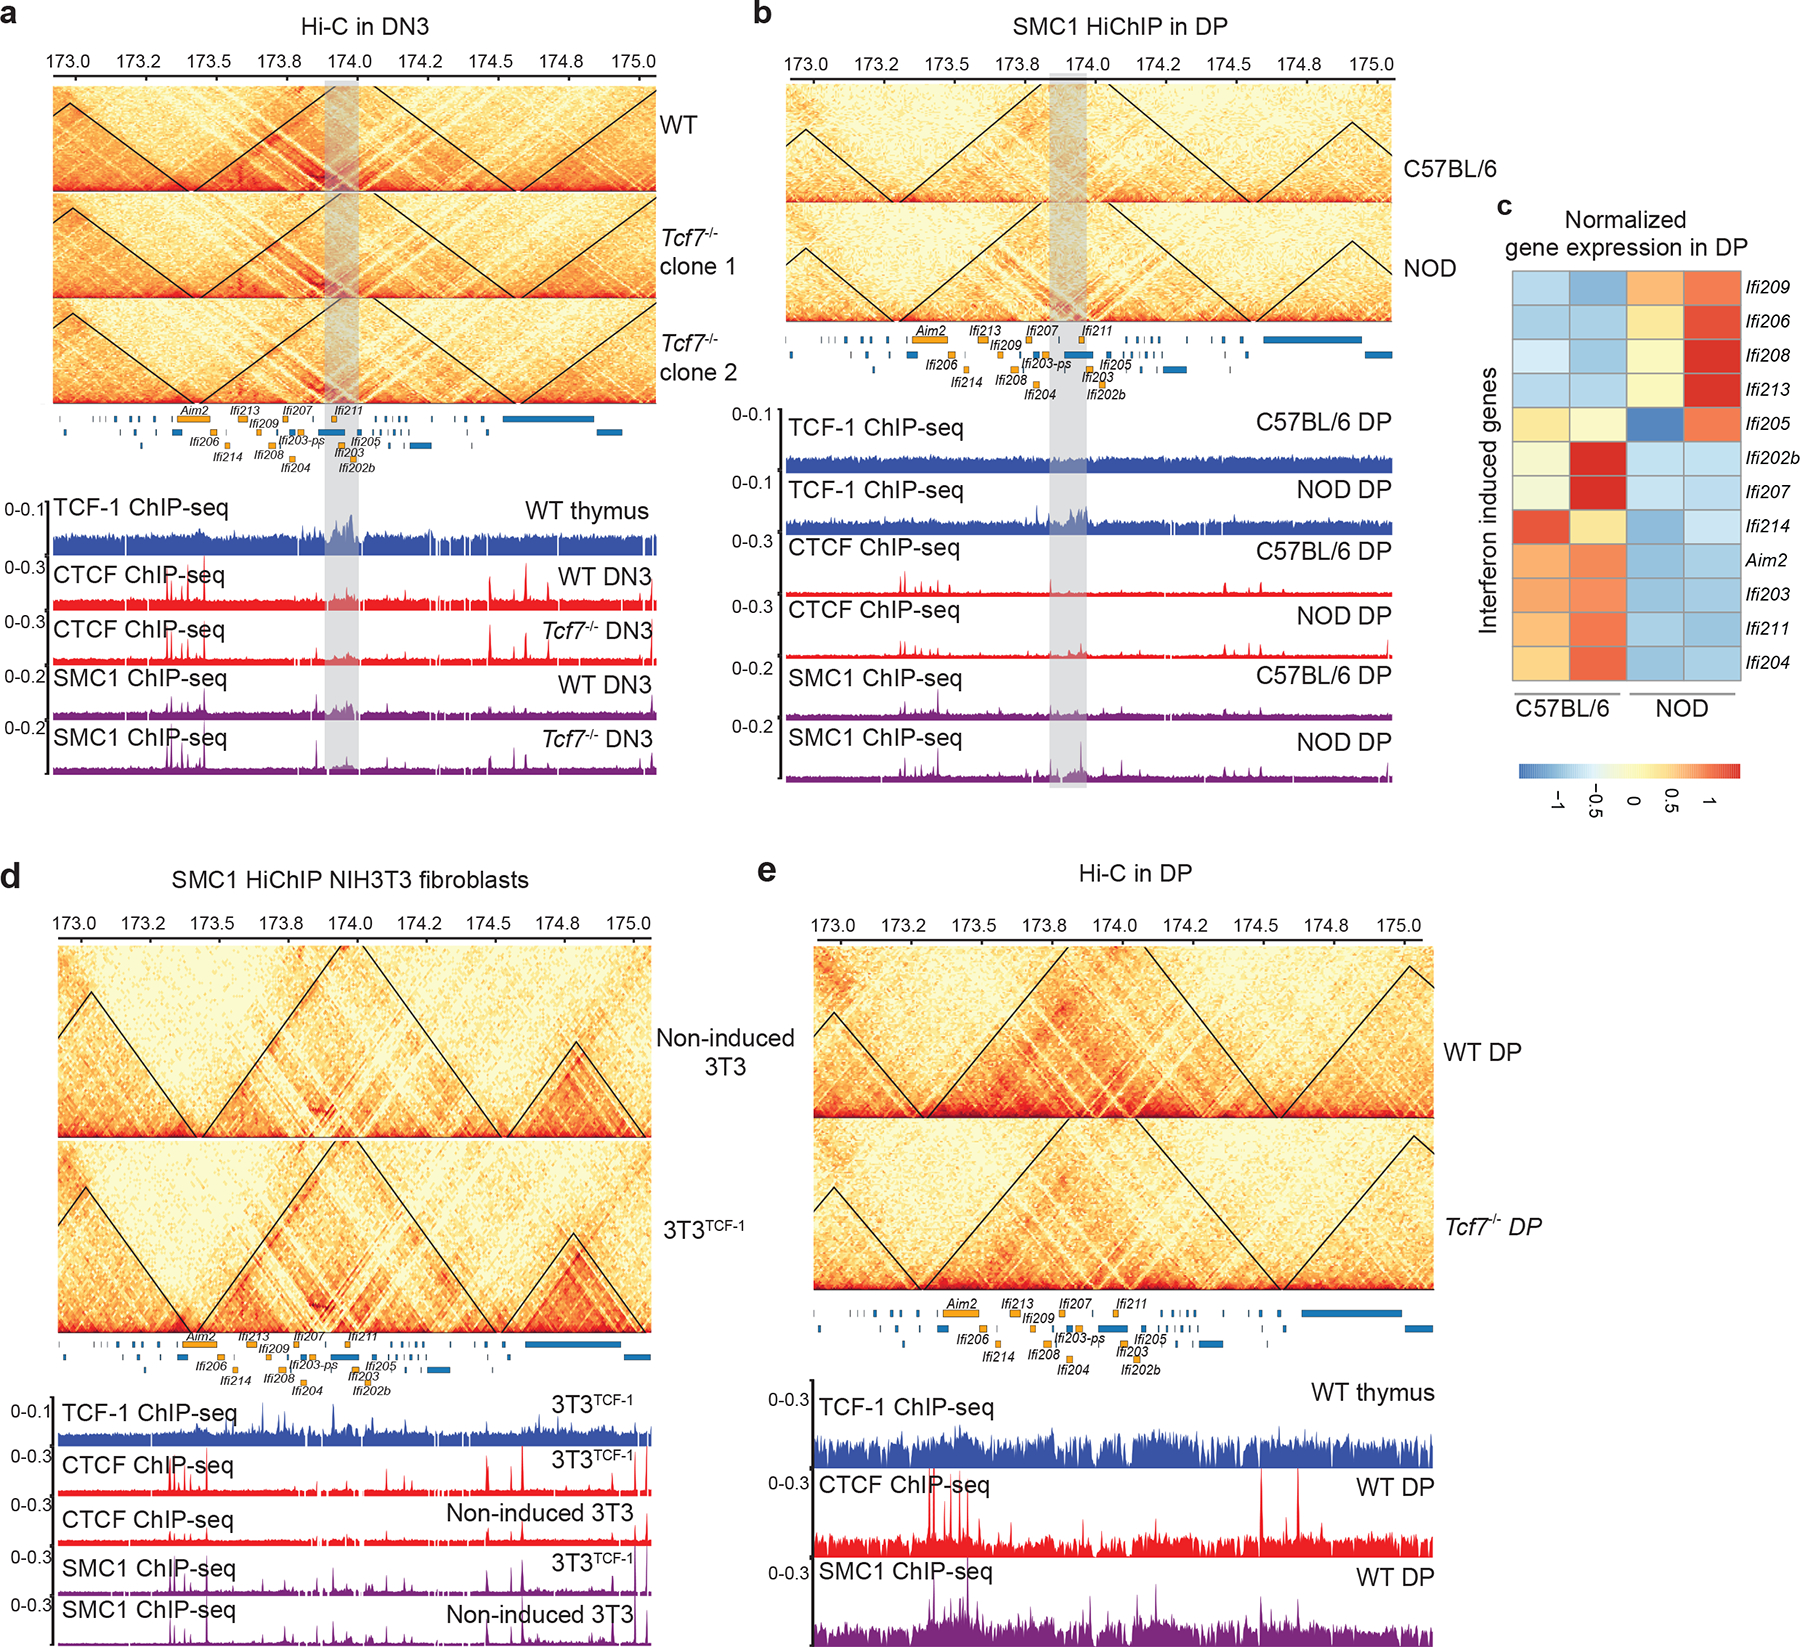
Extended Data Fig. 7. Reorganization of interferon genes by TCF-1.

a,b,d,e. Contact matrix and genome browser views of ultra-deep Hi-C measurements at interferon-induced gene cluster (genes marked in orange) using two independent clones for deleting TCF-1 using CRISPR/Cas9 in DN3 (a), comparing SMC1 HiChIP in DPs of C57BL/6 and NOD mice (b). We used Stripenn to quantify stripiness of the stripe originating from the TCF1 cluster, which showed that NOD has a stripe score of 2.14, while C57BL/6 is -2.3. SMC1 HiChIP in TCF-1 induction in fibroblasts (d), and ultra-deep Hi-C in wildtype and Tcf7−/− DPs (e). The browser view focuses on a TAD that lose intra-TAD interactions after TCF-1 deletion in both replicates, which also have a cluster of TCF-1 binding (grey highlighted) in wildtype DN3s. The CTCF and SMC1 binding in both conditions are also shown. c. Heatmap showing the row normalized gene expression level from DPs in NOD and C57BL/6 of the interferon induced genes in the TAD with different intra-TAD interactions in C57BL/6 and NOD mice. Orange bars represent genomic coordinates of interferon genes.
