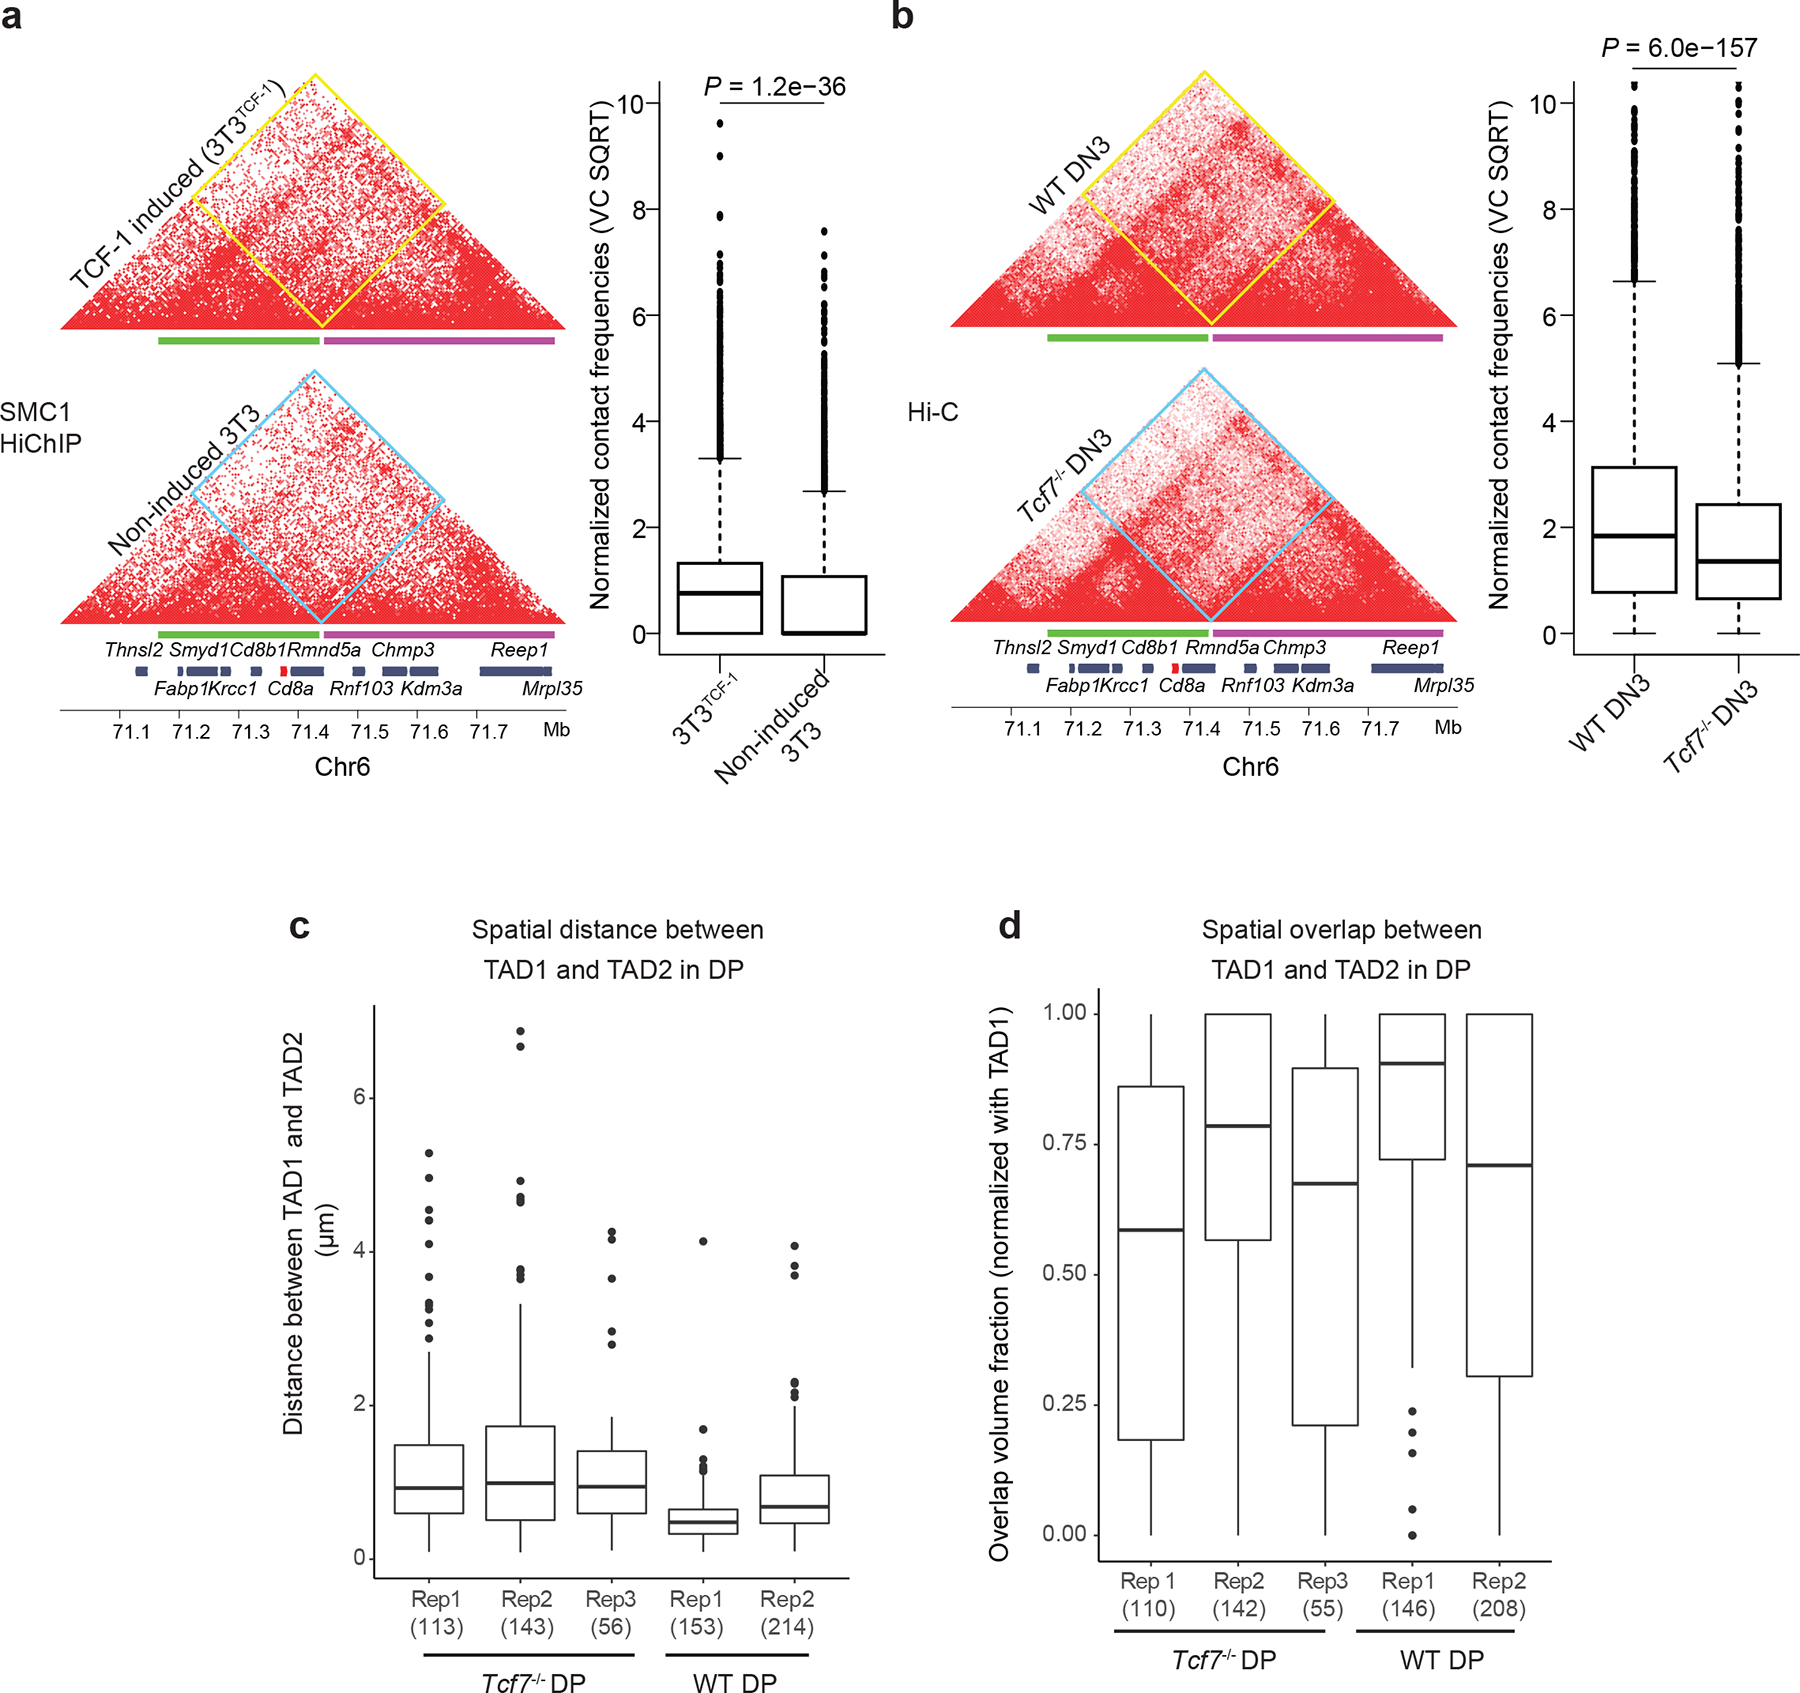
Extended Data Fig. 9. Oligopaint 3D FISH corroborates the role of TCF-1 on chromatin interactions at the Cd8 locus.

a-b. Contact matrix plot of Hi-C data sets at the Cd8a-Cd8b1 locus in NIH3T3 fibroblasts (a) and DN3s (b) (n=7221 genomic interactions). Inter-domain interactions were quantified by boxplots. Two sided Paired wilcoxon ranksum test was performed. Oligopaint probes for TAD1 (green) and TAD2 (magenta) are depicted. Two-sided Wilcoxon rank-sum test P-values are shown for boxplots.
c-d. Box plot showing spatial distance (c) and spatial overlap (d) between TAD1 and TAD2 compared between wildtype (N=2) and TCF-1-deficient (N=3) of DPs in biological mouse replicates. Spatial distance and overlap were calculated as in (Fig. 5d–e). Number of cells used for imaging analysis per mouse is depicted in parenthesis. a-d Data are shown as boxplots (centre, median; box limits, upper (75th) and lower (25th) percentiles; whiskers, 1.5× interquartile range; points, outliers)
