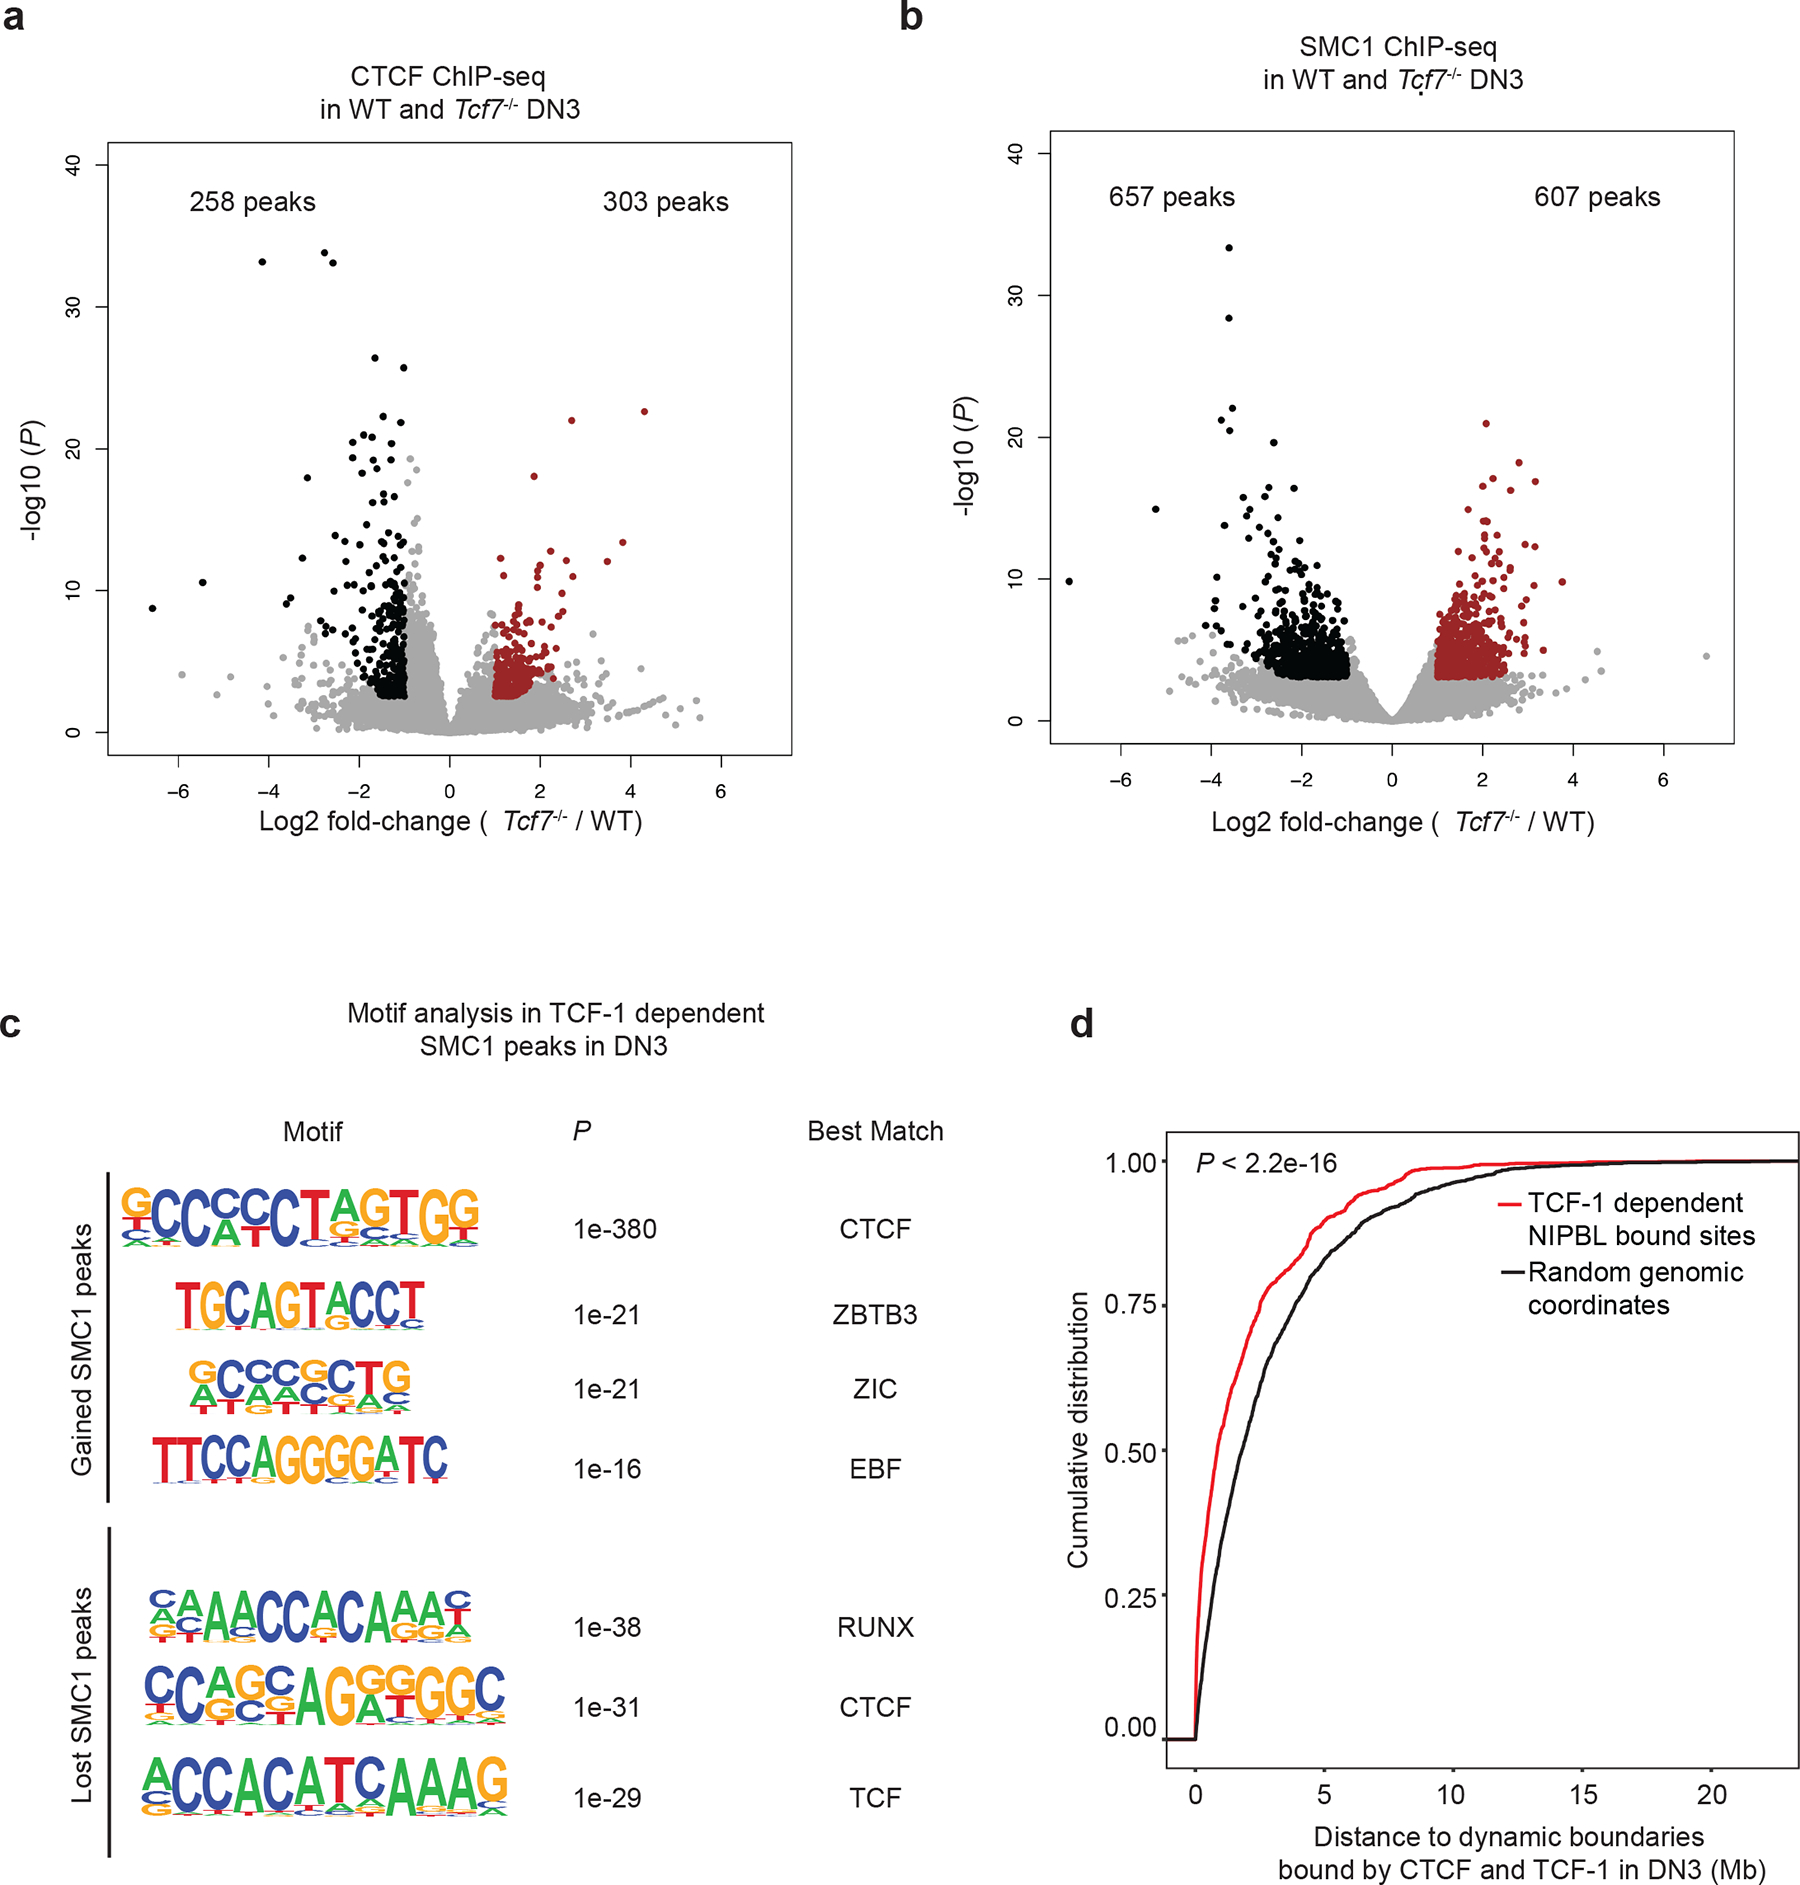
Extended Data Fig. 10. Recruitment of cohesin at TCF-1 binding sites.

a. Volcano plot shows the differential CTCF binding in wildtype and Tcf7−/− DN3s. Red indicates stronger binding after TCF-1 deletion. Log2 fold change and P values are calculated with DEseq2. P depicts adjusted pvalue calculated by DESeq2.
b. Volcano plot showing the differential SMC1 binding in wildtype and Tcf7−/− DN3s. Log2 fold change and P values are calculated with DEseq2. P depicts adjusted pvalue calculated by DESeq2. Red indicates stronger binding after TCF-1 deletion. c. Enriched motifs from HOMER at the gained or lost SMC1 peaks after TCF-1 deletion in DN3 cells using random background. The most significantly enriched motifs and associated P values are shown. P values are calculated using hypergenometric test.
d. Cumulative distribution of genomic distance between 2,042 TCF-1 dependent SMC1 and NIPBL co-bound enhancers or 2,042 randomly selected genomic regions to 988 dynamic boundaries with TCF-1 and CTCF co-binding. Kolmogorov-Smirnov test P-value is shown for cumulative distribution plot.
