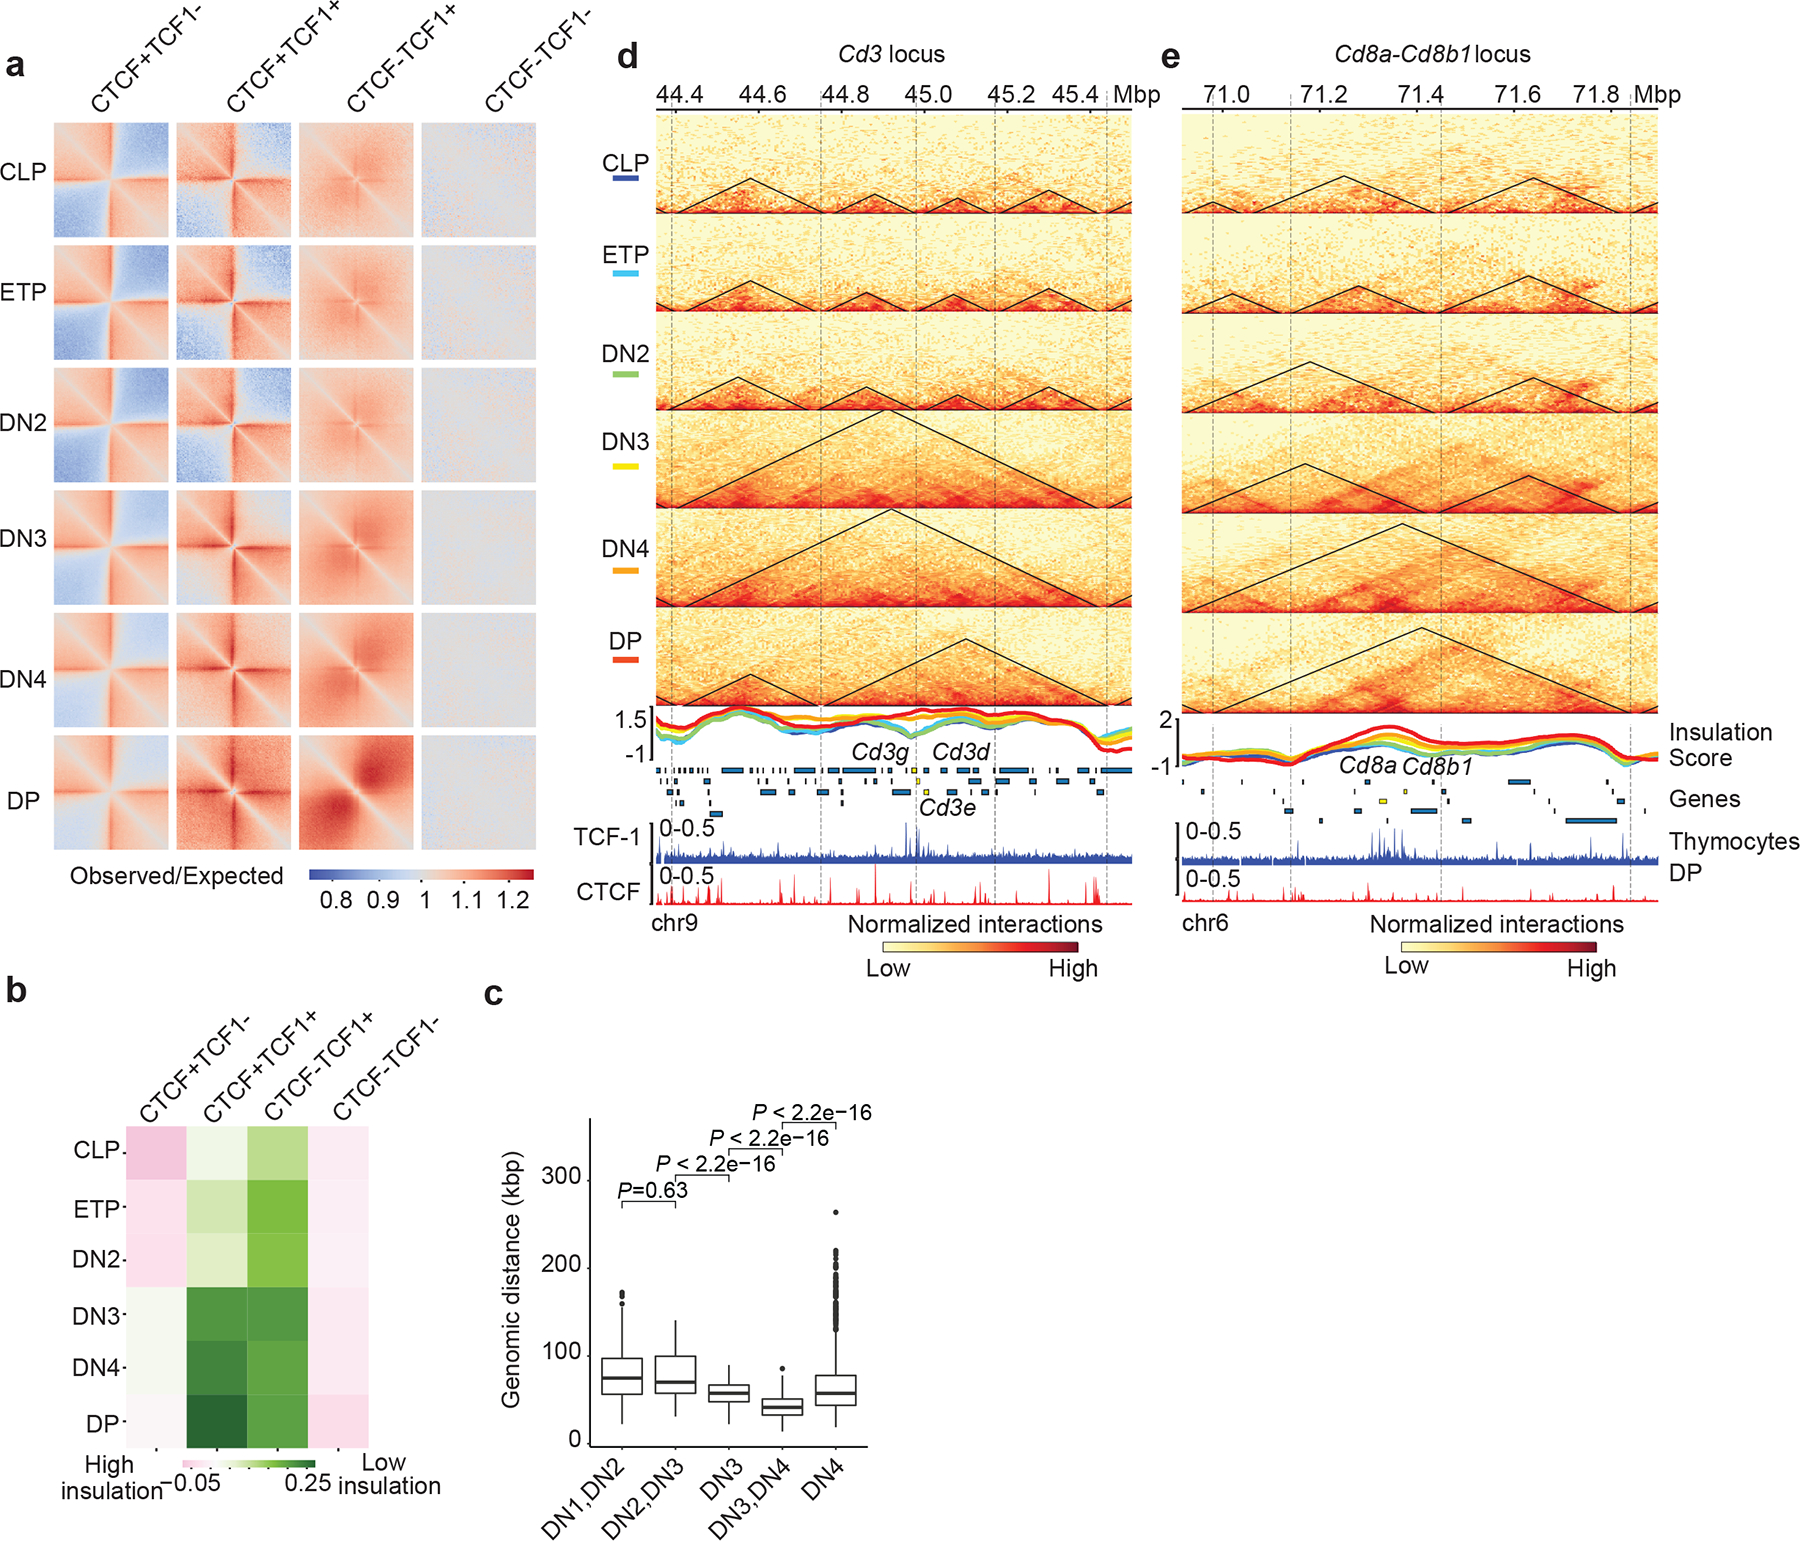
Fig. 2. TCF-1+CTCF sites earmark weakening of insulated neighborhoods.

a. Heatmap showing local pileup interactions using Hi-C data at CTCF-only, CTCF+TCF-1, TCF-1-only peaks and random regions as control. The horizontal line and the vertical line of each plot are the 500 kb region centered on different peak groups.
b. Heatmap showing average insulation score during T cell development at the CTCF only, CTCF+TCF-1 co-bound, TCF-1 only peaks and random regions as control.
c. Boxplots showing distance of marker genes of T cell developmental stages to TCF-1+CTCF peaks. Data are shown as boxplots (centre, median; box limits, upper (75th) and lower (25th) percentiles; whiskers, 1.5× interquartile range; points, outliers). The comparison between different stages was done with two-sided Wilcoxon signed-rank test. The distance between these markder genes and TCF-1+CTCF peaks significantly (P < 2.22 × 10⁻¹⁶) changed except between DN1 and DN2. Selection of marker genes as described in Fig. 1g.
d-e Genome browser view showing the interactions at Cd3d-e (d) and CD8a,b1 (e) loci during T cell development, as well as TCF-1 and CTCF binding events in DPs. Triangles in the heatmap represent TADs called with cooltools. Boundaries are marked as vertical lines. Insulation score in each T cell developmental stage is shown as a line plot and colored according to their developmental stage as indicated in the heatmap legend. Heatmaps are normalized with sequencing depth and ChIP-seq tracks are normalized with count per million (CPM).
