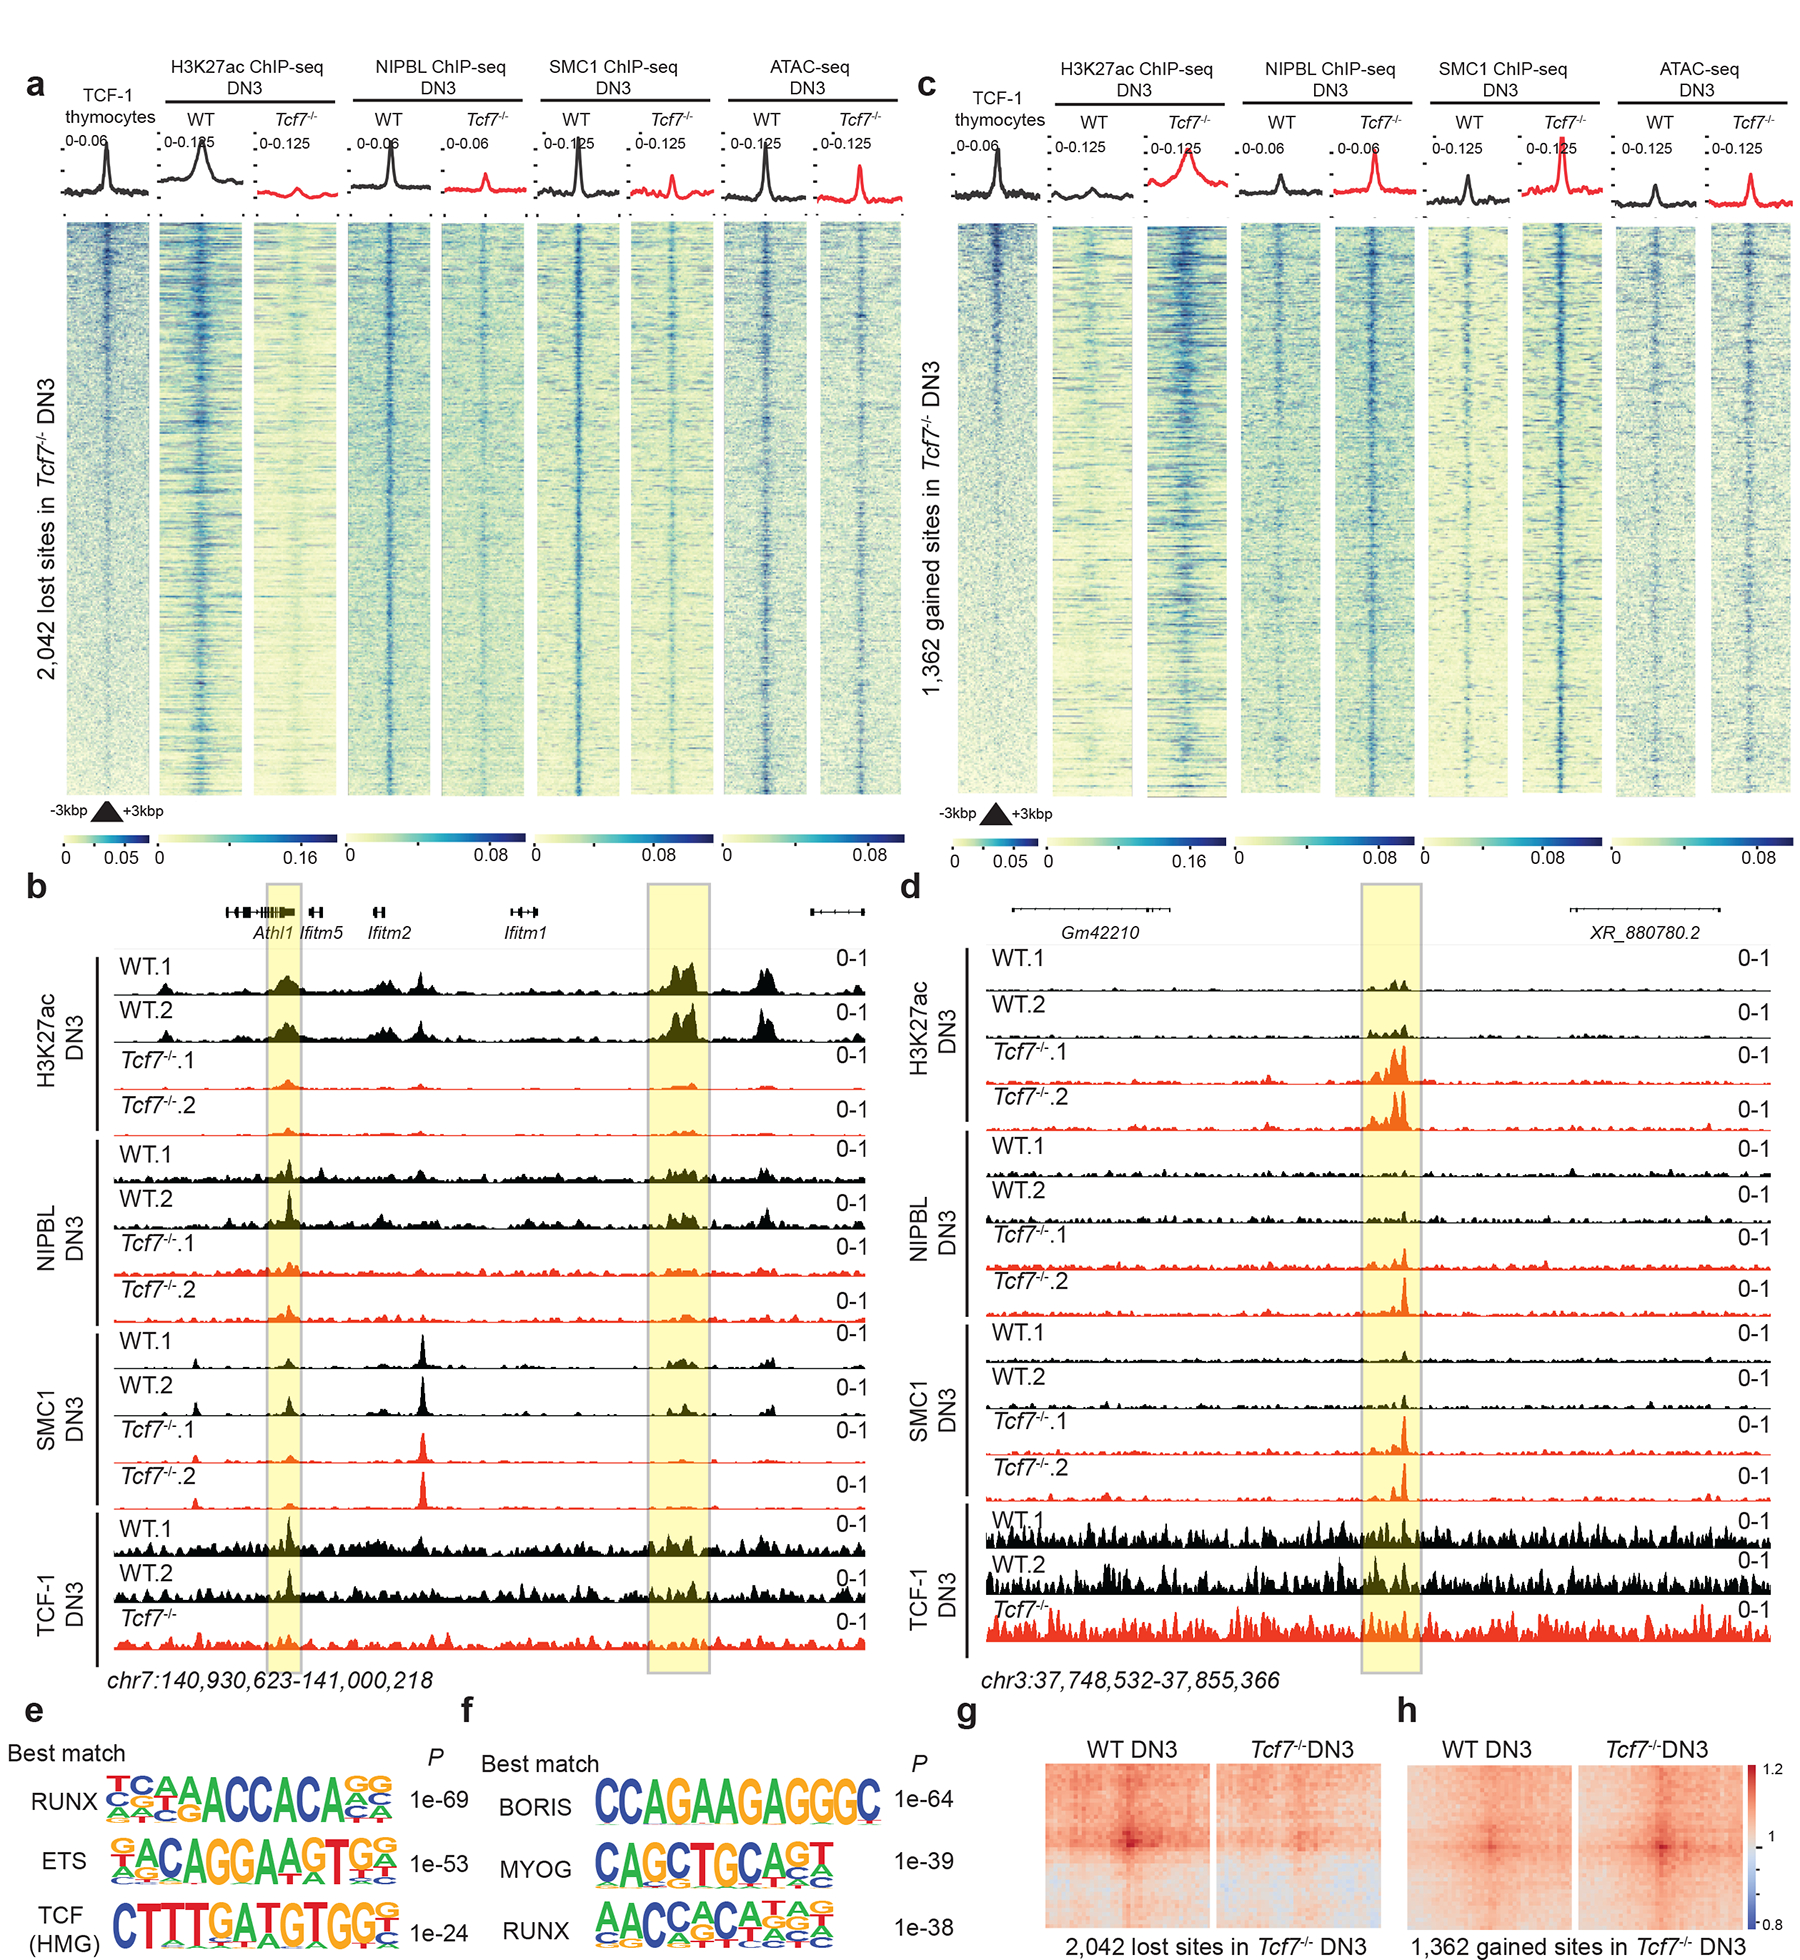
Fig. 6. TCF-1 promotes NIPBL recruitment to active enhancers to reconstruct genome organization.

a,c. Heatmap depicting genomic regions where TCF-1 led to a loss (a) or a gain (c) on the binding events of these proteins in addition to deposition of H3K27ac in DN3s. A binding atlas of cohesin occupancy was created by combining SMC1 and NIPBL peaks across various conditions. DESeq2 was used to determine TCF-1 dependent set of peaks between wildtype and Tcf7−/− cells. Heatmaps show +/− 3kb around peak center. Pubicly available TCF-1 ChIP-seq from thymocytes is used25. H3K27Ac, NIPBL, and SMC1 ChIP-seq and ATAC-seq experiments were generated in DN3s.
b. Genome browser view at a cluster of interferon-induced transmembrane genes. Yellow highlight shows binding of TCF-1 at genomic loci where H3K27ac, SMC1, and NIPBL binding events were concordantly reduced in Tcf7−/− DN3s.
d. Genome browser view of a representative example locus, yellow highlight shows genomic loci where H3K27ac, SMC1, and NIPBL binding events were concordantly increased in Tcf7−/− DN3s.
e-f. Seq-logos demonstrating top motif enrichment based on Homer analysis of genomic regions in which occupancy of cohesin was lost (e) or gained (f) in Tcf7−/− DN3s compared to random background regions. P values are calculated using hypergenometric test.
g-h. Local pileup of long-range interactions anchored at genomic regions described in (a) and (c) with lost (g) and gained (h) occupancy. Hi-C data in DN3s were used.
