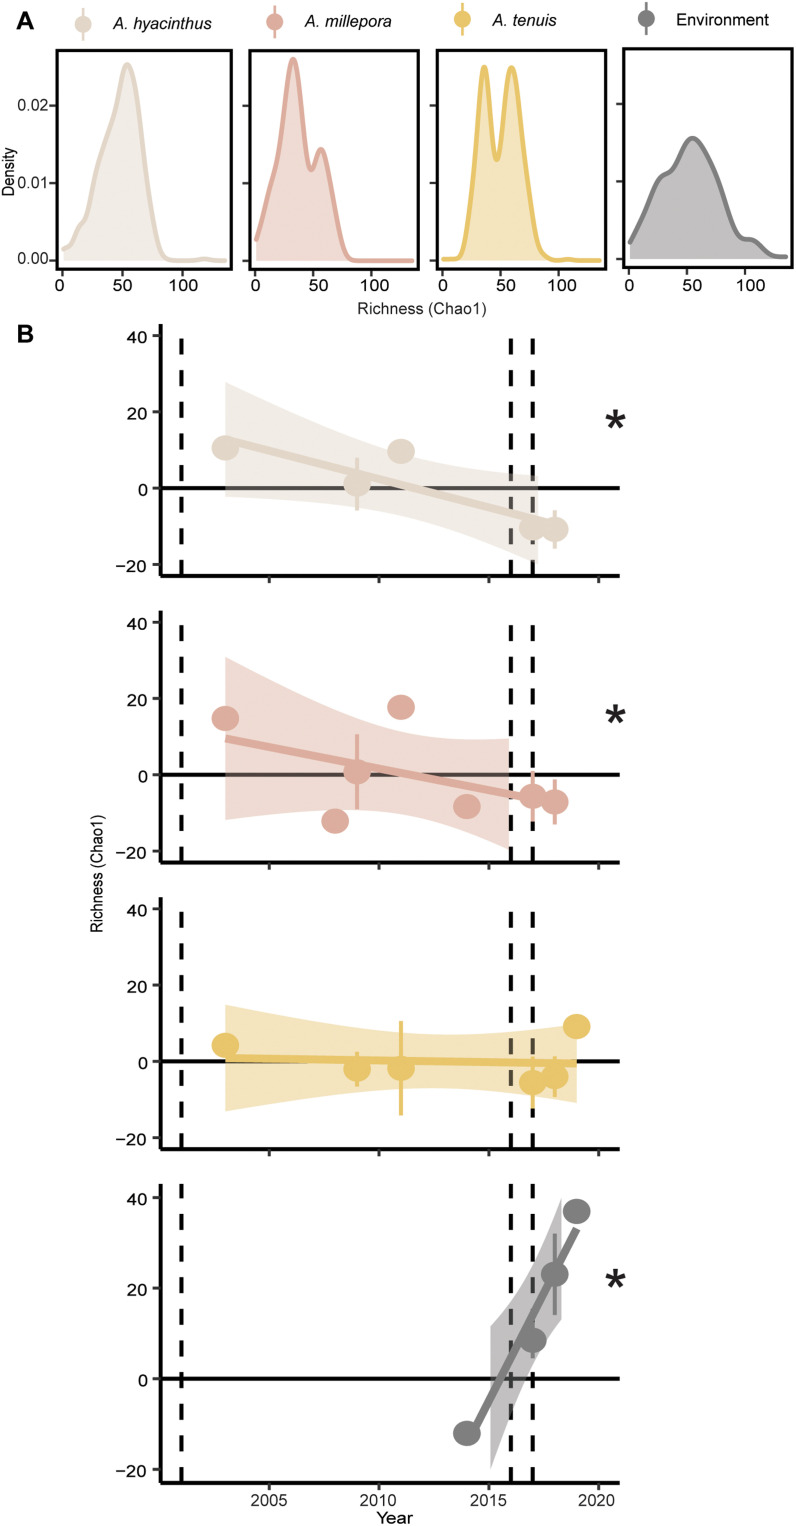
Fig. 4. Changes in Symbiodiniaceae richness in coral and environmental samples collected along reefs from the GBR before and after the 2016 mass bleaching.
(A) The Chao1 richness of ASVs, from 2003 to 2019, collected from reefs colored by sample type. The number of samples (density, y axis) corresponding to the Choa1 metric for each sample type. (B) The means ± SD of Chao1 richness shown as the linear trend of the metric through time. The dashed lines represent the 2002, 2016, and 2017 mass bleaching events. Asterisks (*) signify significant differences calculated with linear mixed effects models (lmer, P < 0.05; exact statistical values in table S7; n values in table S1) in community composition between coral species and environmental samples. The colors correspond to each of the four sample types (gray, A. hyacinthus; pink, A. millepora; yellow, A. tenuis; black, environment).

