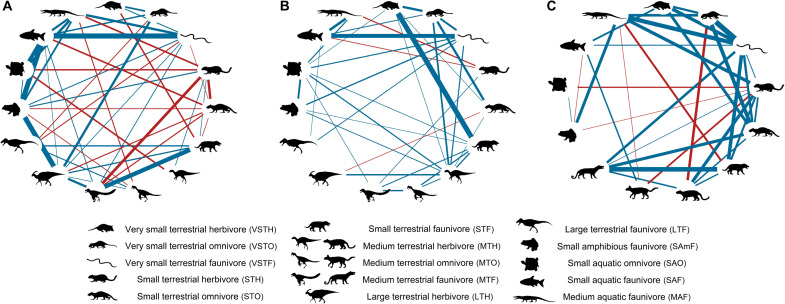
Fig. 2. Partial correlation networks before and after the end-Cretaceous mass extinction.
Nodes represent the trophic guilds that constitute the food webs of the latest Cretaceous [(A) Campanian and (B) Maastrichtian] and early Paleogene [(C) Danian]. Line thickness is scaled to the linkage strength, and colors indicate positive (blue) or negative (red) partial correlation coefficients. Silhouettes were obtained from http://phylopic.org/ (see Acknowledgments).

