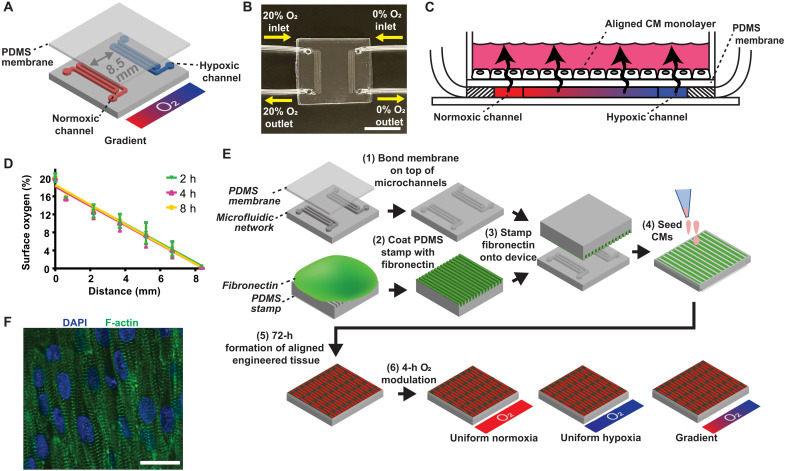
Fig. 1. Fabrication and characterization of the O2 gradient myocardial infarct border-zone-on-a-chip.
(A) O2 gradient condition with gas flow through two serpentine microchannel networks separated by 8.5 mm. (B) Fabricated O2 gradient device with gas perfusion microchannels connected to microbore tubing. Scale bar, 10 mm. (C) Cross-sectional schematic showing diffusion of perfused gases across the PDMS membrane to expose the cells to an O2 gradient. (D) Validation of the surface O2 profile. Error bars indicate means ± SD. Solid lines indicate the linear regression. (E) Fabrication and experimental flowchart schematic. (F) Anisotropically aligned engineered cardiac tissue. DAPI (blue) and phalloidin staining of F-actin (green). Scale bar, 20 μm.

