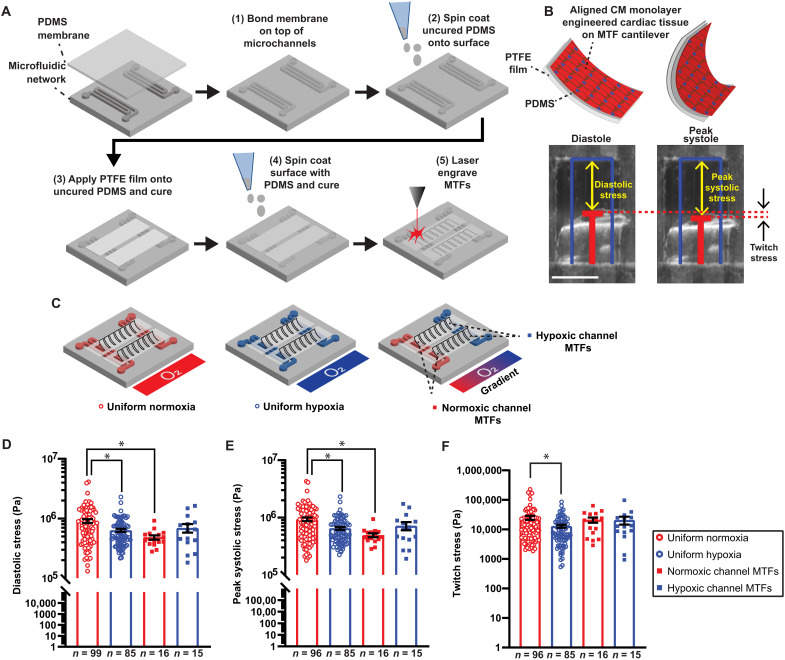
Fig. 4. Contractile stresses generated by engineered cardiac tissues exposed to different O2 conditions during 2Hz electrical pacing.
(A) Flowchart of the fabrication of O2 controlled MTF devices. (B) Tissue stress generation reduces the radius of curvature as MTFs contract from diastole to peak systole. Original length of the MTF film (blue) and tracked film edge (red). Scale bar, 1 mm. (C) MTFs in the different O2 conditions: uniform normoxia (red open circle), uniform hypoxia (blue open circle), normoxic channel (red square) of the O2 gradient, and hypoxic channel (blue square) of the O2 gradient. Quantification of (D) diastolic stress, (E) peak systolic stress, and (F) twitch stress. Black lines with error bars indicate means ± SEM. *P < 0.05 (Kruskal-Wallis test, comparing the mean rank of each group with the mean rank of the uniform normoxia group, Dunn’s multiple comparison post hoc test).

