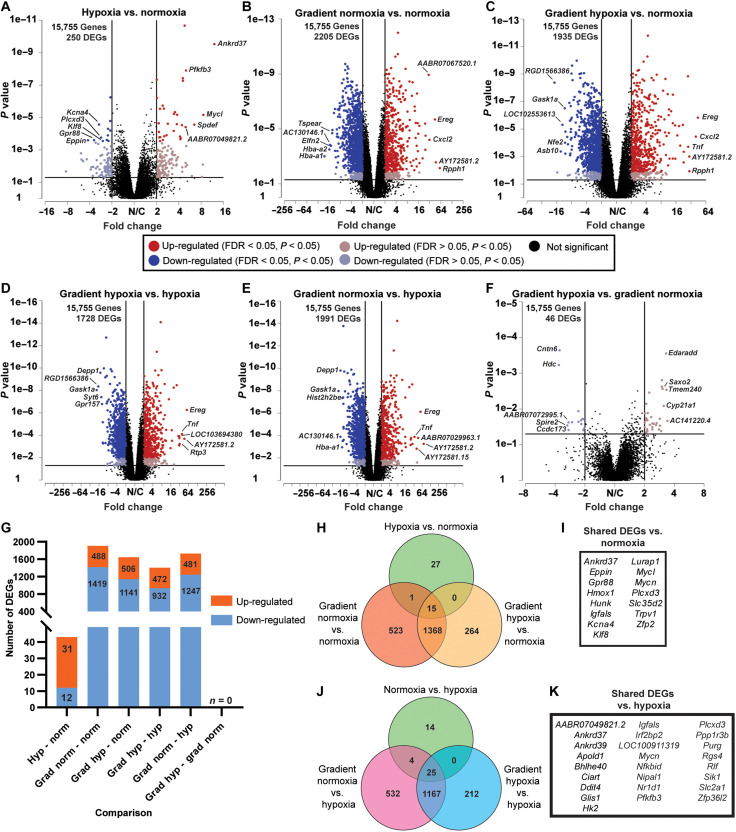
Fig. 5. DEGs in engineered cardiac tissues exposed to different O2 conditions.
(A to F) Volcano plots of pairwise comparisons with down-regulated (blue) and up-regulated (red) genes [P < 0.05, absolute value of the fold change (|fold change|) ≥ 2]. The black horizontal and vertical lines distinguish the fold change and P value cutoff for DEGs. The top 5 down-regulated and up-regulated genes with the highest |fold change| are labeled by gene symbol. (G) Quantification of down-regulated (light blue) and up-regulated (orange) genes with P < 0.05, FDR < 0.05, and |fold change| ≥ 2. (H) Venn diagram indicating the overlap of identified DEGs in the comparisons versus uniform normoxia. (I) List of the 15 shared DEGs in the comparisons with uniform normoxia. (J) Venn diagram indicating the overlap of identified DEGs in the comparisons versus uniform hypoxia. (K) List of the 25 shared DEGs in the comparisons with uniform hypoxia.

