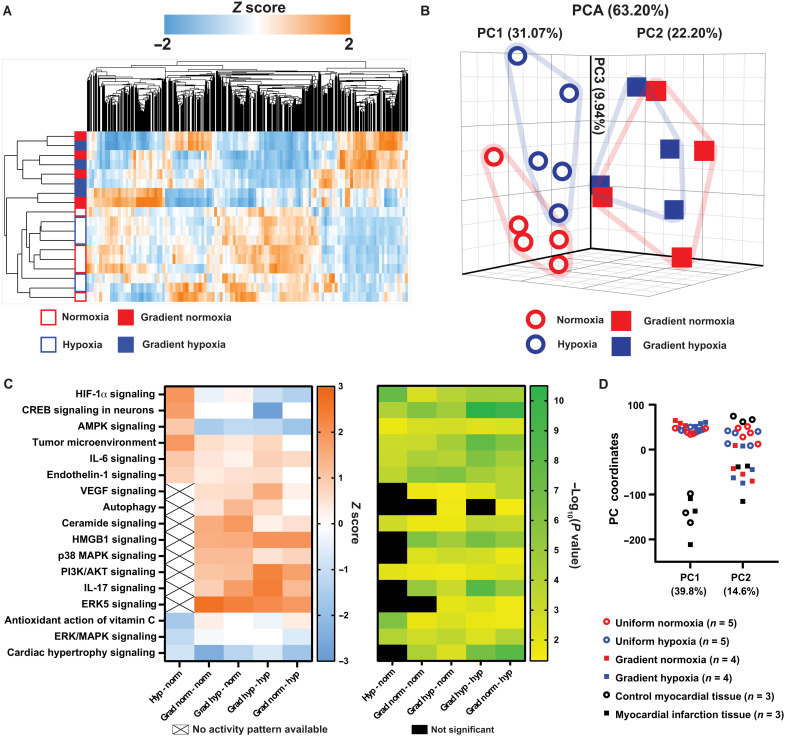
Fig. 6. PCA and pathway analysis of the RNA-seq data from the engineered cardiac tissues.
(A) Hierarchical clustering heatmap of the samples exposed to uniform normoxia (open red outline), uniform hypoxia (open blue outline), normoxic side of the gradient (solid red), and hypoxic side of the gradient (solid blue). (B) PCA plot of normoxia (open red circle), hypoxia (open blue circle), normoxic side of the gradient (red squares), and hypoxic side of the gradient (blue squares). The percent of total variance due to the first three PCs is labeled. (C) Heatmap of select canonical pathways and the associated z score (left) and −log10(P value) (right) for the indicated pairwise comparison. (D) PC coordinates of PC1 and PC2 after comparative analysis of the in vitro devices with in vivo rat MI and control myocardium.

