. 2022 Dec 7;11:e80207. doi: 10.7554/eLife.80207

Figure 3. Two separate extrachromosomal DNA (ecDNA) populations do not cluster in the nucleus.

(A) Representative maximum intensity projection images of DNA FISH for CDK4 (green) and PDGFRA (red) in an E25 nucleus. Blue=DNA (DAPI) . Scale bar = 1 μm. (B) Cumulative frequency distribution of shortest interprobe distances (CDK-CDK, PDGFRA-PDGFRA, CDK4-PDGFRA, and PDGFRA-CDK4) between all foci in each nucleus across all E25 nuclei (n=26). (C) (Left) Representative maximum intensity projection image shown of E25 nucleus hybridized with probes for CDK4 (green) and PDGFRA (red). Blue=DNA (DAPI). Scale bar = 5 μm. (Right) Ripley’s K function for this nucleus showing observed K function (red), max/min/median (black) of 10,000 null samples with p=0.05 significance cut-off shown (empty black circle) for CDK4, PDGFRA, and CDK4 and PDGFRA spots combined. (D) Ripley’s K function for E25 nuclei showing number of nuclei with significant and non-significant clustering at each given radius for CDK4 spots (n=13 nuclei), PDGFRA spots (n=9 nuclei), and CDK4 and PDGFRA spots combined (n=9 nuclei). p-values were calculated using Neyman-Pearson lemma with optimistic estimate p-value where required (see Materials and methods), and Benjamini-Hochberg procedure (BHP, FDR = 0.05). Metaphase analysis of E25 cells and Ripley’s K analysis with smaller foci are in Figure 3—figure supplement 1. (E) Representative maximum intensity projection image of E20 interphase nuclei hybridized with probes for CDK4 (green) and PDGFRA (red). Scale bar = 5 μm. (F) As in (E) but for a nucleus where the close association of CDK4 and PDGFA signal in doublets is indicative of ecDNAs harbouring both oncogenes. Scale bar = 1 μm in main panel (G) as in (E) but showing an E20 nucleus with doublets of CDK4 foci. Metaphase analysis of E20 cells with CDK4 and PDGFRA probes in Figure 3—figure supplement 2. (H) As in (B) but for E20 nuclei (n=24) (noting all nuclei shown here harbored >20 foci of each oncogene). (I) As in (D) but for E20 nuclei.

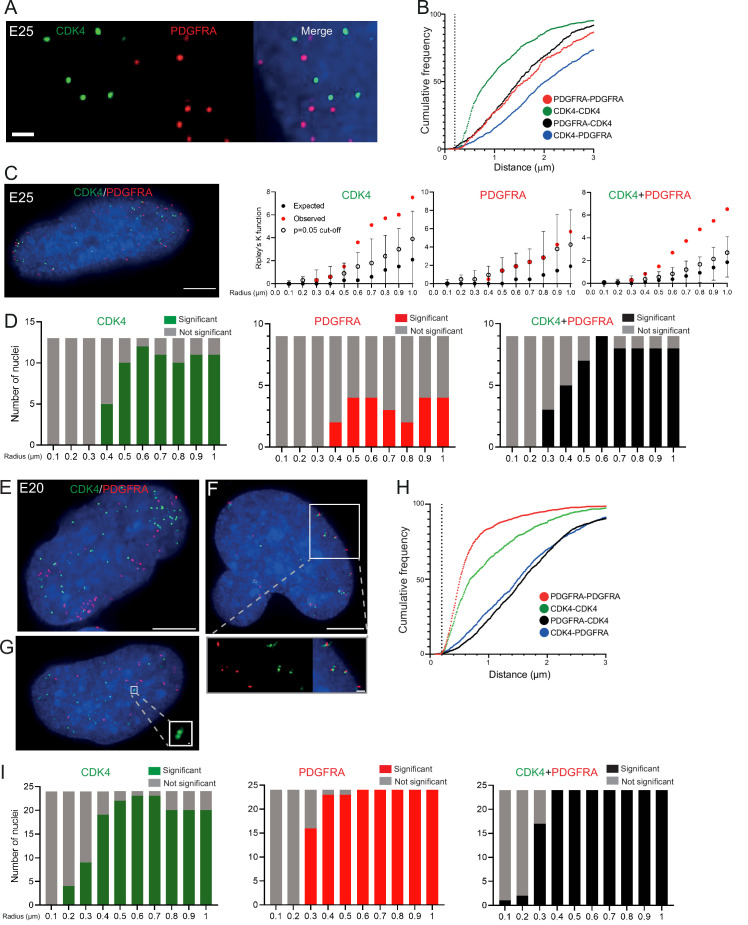
Figure 3—source data 1. Statistical data for Figure 3—figure supplement 1.
Median number of CDK4 and PDGFRA DNA FISH foci in E25 cell line (n=26) nuclei. Data are for Figure 3—figure supplement 1B. Mean shortest interprobe distance and shortest interprobe distance between CDK4 and PDGFRA DNA FISH foci in E25 cell line. Statistical analysis of data for Figure 3—figure supplement 1C and D, Interprobe distance (μm) between fosmids indicated = median values shown. Value in brackets indicates adjusted p-value (adj) = Bonferroni. n=26 nuclei.

Figure 3.

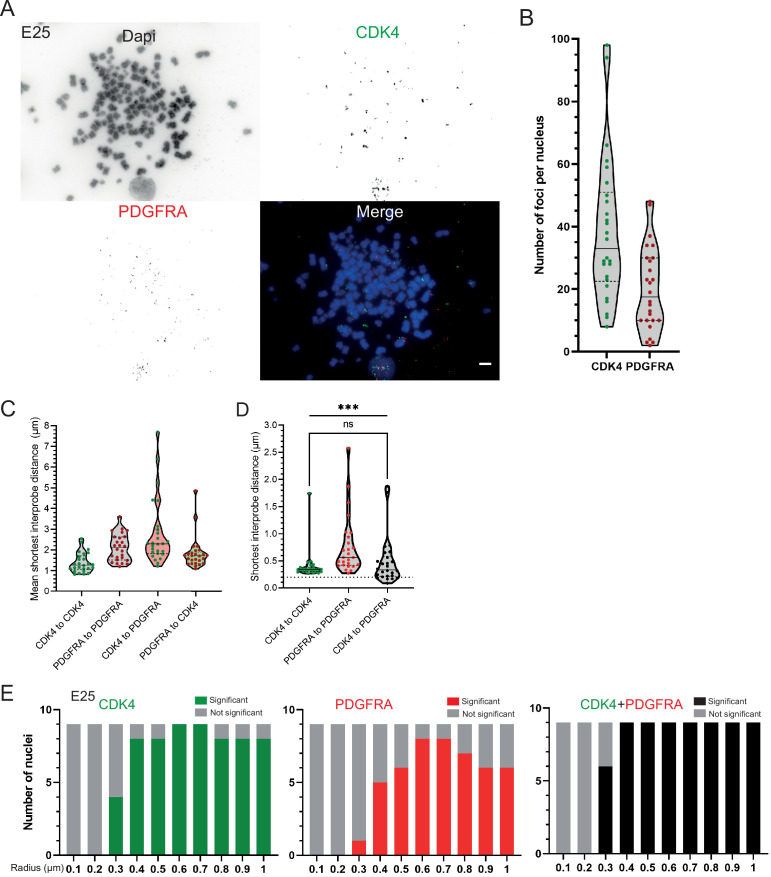
Figure 3—figure supplement 1. Additional analysis of the distribution of CDK4 and PDGFRA ecDNAs in the E25 cell line.

Figure 3—figure supplement 1.

(A) DNA FISH for CDK4 and PDGFRA on metaphase spreads from the E25 cell line, showing CDK4 and PDGFRA on separate extrachromosomal DNA (ecDNA), scale bar = 5 μm. (B) Number of ecDNA per nucleus in E25 cell line, CDK4 (green) and PDGFRA (red). (C) Violin plots showing distribution of mean shortest distance between CDK4 and PDGFRA foci per E25 nucleus. (D) As for (C) but showing the shortest single interprobe distance measured in any nucleus. Dotted line denotes y=200 nm. Statistical significance examined by Mann-Whitney test (hooked line, ns = not significant) and Kruskall-Wallis (straight line, *** p<0.001). Statistical data are detailed in Figure 3—source data 1. (E) Ripley’s K function for E25 nuclei showing number of nuclei with significant and non-significant clustering at each given radius for CDK4 spots, PDGFRA spots, and CDK4 and PDGFRA spots combined − with spot diameter = 150 nm. All p-values for Ripley’s K function calculated using Neyman-Pearson lemma with optimistic estimate p-value where required, and Benjamini-Hochberg procedure (BHP, FDR = 0.05).
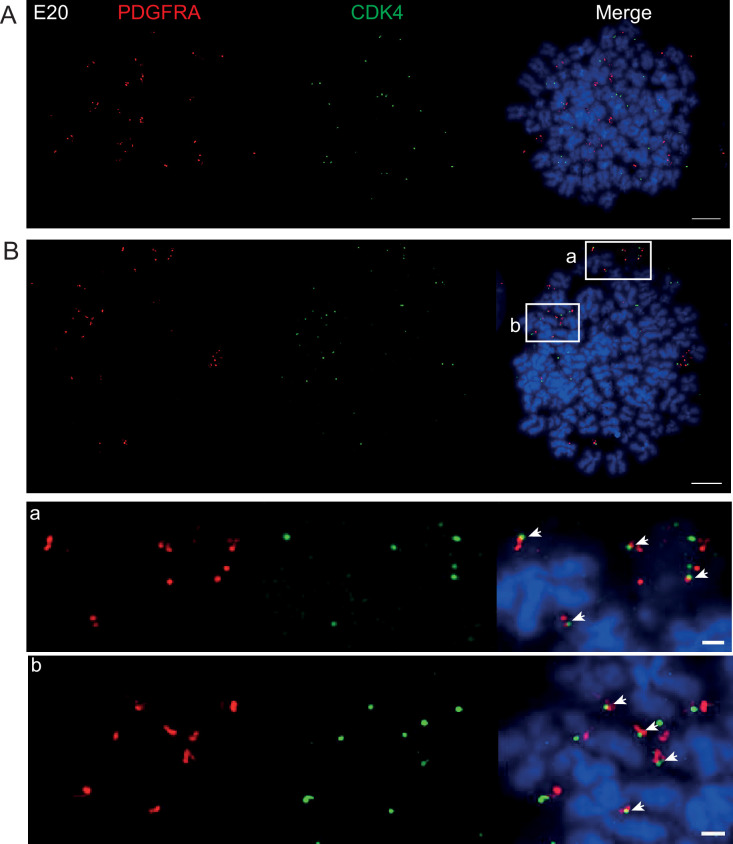
Figure 3—figure supplement 2. DNA FISH on metaphase spreads of the E20 cell line showing hybridization signal for PDGFRA (red) and CDK4 (green).

Figure 3—figure supplement 2.

Scale bar = 10 μm. (A) Metaphase spread representative of most cells with PDGFRA and CDK4 clearly on separate extrachromosomal DNA (ecDNAs). (B) Metaphase spread showing an example, representative of approximately 10% of cells where PDGFRA and CDK4 of signals are juxtaposed, suggesting that both oncogenes are located on the same ecDNA. Scale bar = 10 μm. Insets a and b are shown zoomed in below (scale bar 1 μm). Note these are representative images of metaphase spreads where both oncogenes were located on ecDNA – we observed many metaphases with primarily CDK4 ecDNA and few/no PDGFRA ecDNA. Subsequent interphase nuclei were therefore only imaged if >20 CDK and >20 PDGFRA foci to ensure ecDNA of both were present, and to allow Ripley’s K analysis.