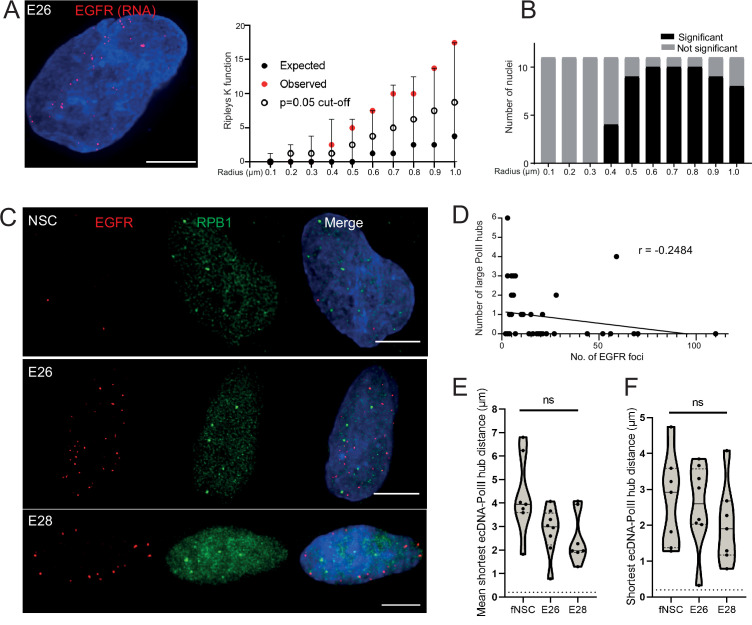
Figure 4. Extrachromosomal DNA (ecDNA) do not colocalize with large foci of the transcriptional machinery.
(A) Representative maximum intensity projection image of nascent EGFR RNA FISH (red) in E26 cell nucleus,(blue=DNA). Scale bar = 5 μm. Associated Ripley’s K function for this nucleus showing observed K function (red), max/min/median (black) of 10,000 null samples with p=0.05 significance cut-off shown (empty black circle). (B) Ripley’s K function for E26 nuclei (n=11) after EGFR nascent RNA FISH showing number of nuclei with significant and non-significant clustering at each given radius. All p-values for Ripley’s K function calculated using Neyman-Pearson lemma with optimistic estimate p-value where required, and Benjamini-Hochberg procedure (BHP, FDR = 0.05). (C) Representative maximum intensity projection images of immunoFISH in neural stem cell (NSC), E26 and E28 cell lines: Immunofluorescence for RPB1 (green) and EGFR DNA FISH (red). Scale bar = 5 μm. (D) Spearman’s correlation between number of EGFR foci and number of RPB1 foci, p = 0.13, E26 and E28 cell line data combined. (E) Violin plot of distribution of mean shortest interprobe distance per nucleus between EGFR foci and PolII foci in NSC (n=7), E26 (n=8) and E28 (n=7) cell lines. (F) As for (E) but for shortest single distance in each nucleus. ns, not significant. Kruskall-Wallis test. Statistical data relevant for this figure are in Figure 4—source data 1.


