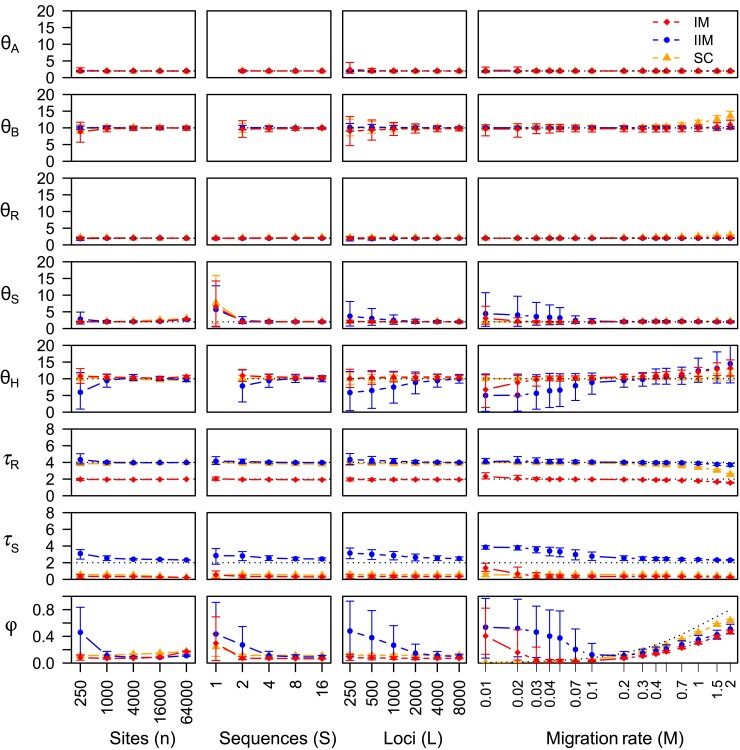
Fig. 3.
Average posterior means and 95% HPD CIs for parameters in the MSci model of figure 1d over 30 replicate datasets simulated under the migration (IM, IIM, and SC) models of figure 1a–c, plotted against the number of sites per sequence (n), the number of sequences per species (S), the number of loci (L), and the migration rate (). Parameters in the migration model are given in the legend to figure 1. In the standard setting, each dataset consists of loci, with sequences per species at each locus and sites per sequence, and the migration rate was individuals per generation. In the four sets of simulations, one of the factors () varies whereas the others are fixed. When , population sizes , , and are unidentifiable. Estimates of and parameters are multiplied by . Dotted lines indicate true values of identifiable parameters, except in the plot of against , where it represents of equation (10), (which is identical for the IM, IIM, and SC models of fig. 1). Note that the n, S, L, and axes are all on the logarithmic scale.

