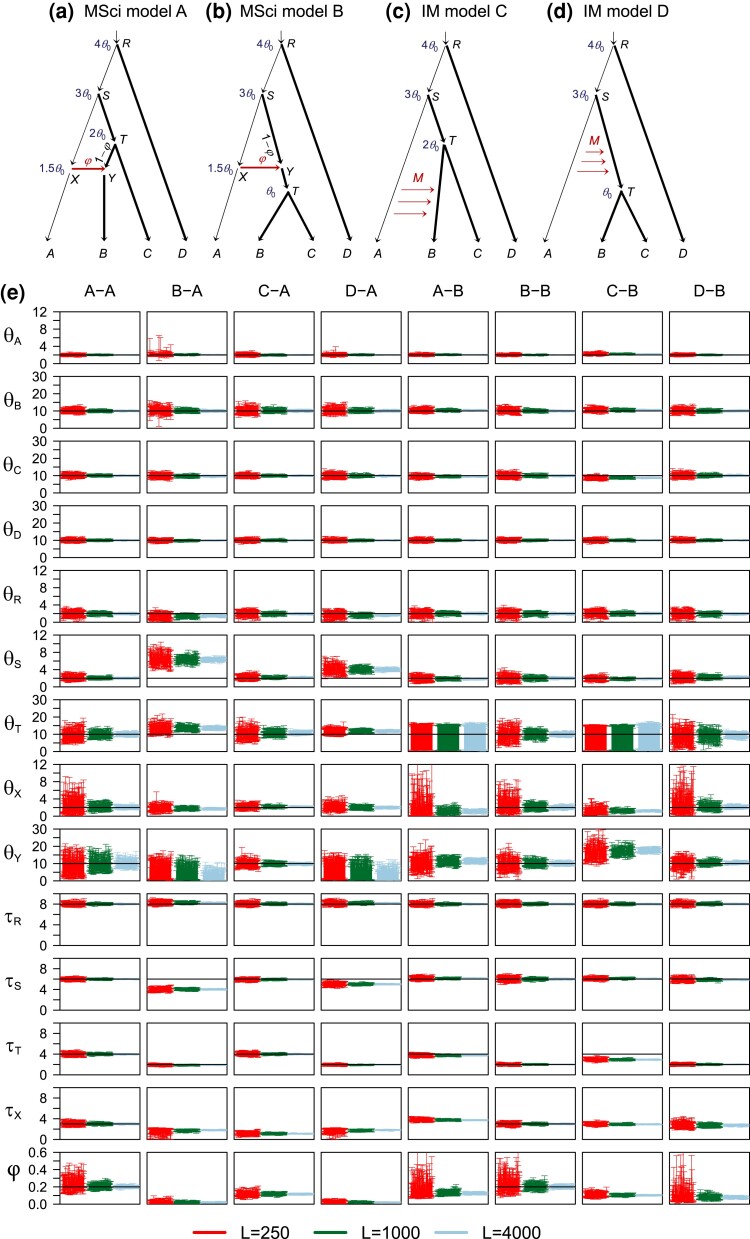
Fig. 4.
(a,b) Two introgression (MSci) models and (c,d) two migration (IM) models used in simulation. The thin branches have the population size and the thick branches have . In MSci model A, the species divergence/introgression times are , , , and . In MSci model B, , , , and . Introgression probability is . In the IM model C, , , and , with migration occurring from species A to B over time period () at the rate migrants per generation. In the IM model D, , , and , with migration from species A to ST over time period () at the rate . (e) The 95% HPD CIs for parameters in 100 replicate datasets of , 1,000, and 4,000 loci. Column labels refer to the simulation model followed by the analysis model; for example, “B-A” means that data were simulated under model B and analyzed under model A. The values of and parameters are multiplied by . Black solid line indicates the true value.

