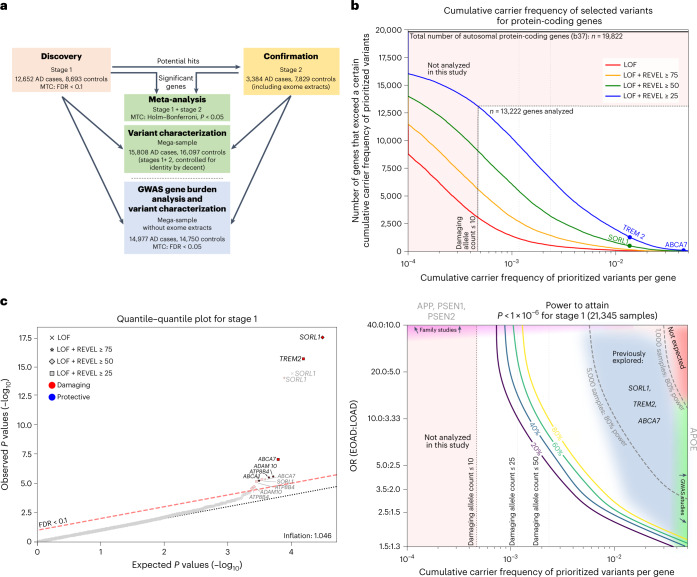
Fig. 1. Study setup and power.
a, Schematic of the study setup. The AD association of genes identified in stage 1 was confirmed in stage 2 and significance was determined by meta-analysis. Variant characteristics were investigated in a merged mega-sample rather than the meta-sample, allowing more accurate variant effect size estimates for variant categories/age-at-onset bins. The mega-sample (without exome extracts) was also used for the GWAS gene burden analysis. MTC, multiple testing correction. b, Top, number of genes (y axis) with at least a certain cumulative carrier frequency of prioritized variants (x axis), prioritized according to different deleteriousness thresholds. White box, genes with a cMAC ≥ 10 (cumulative minor allele count of ≥10 prioritized alleles identified across the 12,652 cases and 8,693 controls in the stage 1 sample) were considered to have sufficient carrier frequency to allow burden analysis. The SORL1, TREM2 and ABCA7 genes are indicated, revealing that carriers of rare damaging variants in these genes are relatively common, allowing identification in smaller sample sizes3–7. Bottom, power analysis for stage 1, to attain a P < 1 × 10⁻⁶, at the same scale as the top figure. For comparison, we indicate 80% power thresholds for sample sizes of 1,000 and 5,000 individuals (subsampled from stage 1). Cumulative carrier frequency and estimated effect size ranges are indicated for common variants identified to associate with AD by GWAS (green), rare-variant burdens in SORL1, TREM2 and ABCA7 identified using sequencing studies3–7 (grey/blue), and for rare variants observed in autosomal dominant AD (magenta). Common variants with high effect sizes (red) are not expected to exist. Genes with cMAC < 10 were not analyzed (pink). Power calculations show that aggregating more cases and controls might allow for the identification of rare-variants that have a large effect on AD but for which only few carriers are observed, or for variants that have a modest/average effect on AD, for which many carriers are observed (power calculations shown in Supplementary Table 6). c, Quantile–quantile plot of P values determined in the stage 1 discovery analysis based on an ordinal logistic burden test. For each of 13,222 genes, we tested the burden of variants adhering to four variant deleteriousness thresholds, conditional on having a cMAC ≥ 10 (n = 31,204 tests). Threshold for multiple testing correction: FDR < 0.1, P value inflation, 1.046. Gene names in black indicate the deleteriousness threshold of the most significant burden test in that gene.

