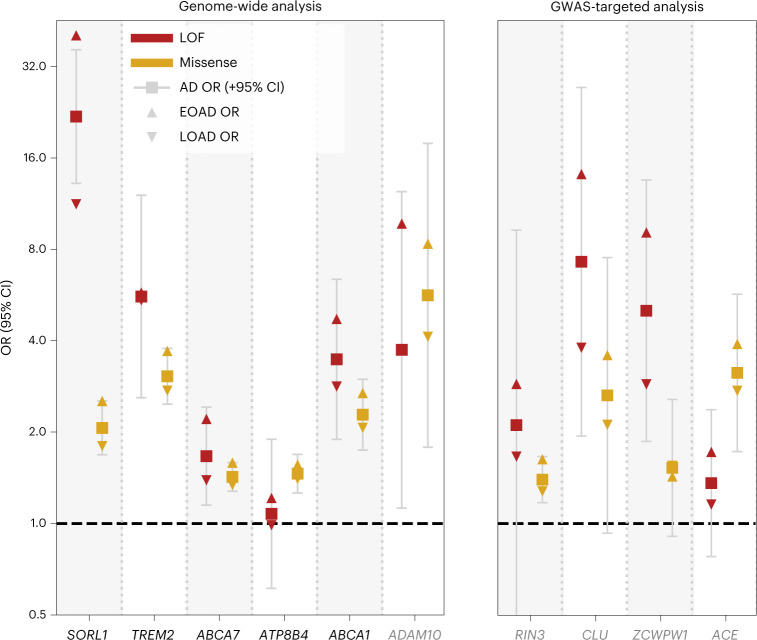
Fig. 3. ORs according to age at onset and variant pathogenicity.
ORs for LOF (red) and missense (yellow) variants as observed in the mega-sample (n = 31,905). Case/control OR (square, 95% CI), EOAD OR (triangle pointing upward), LOAD OR (triangle pointing downward). Missense variants in the considered gene appertained to the variant deleteriousness threshold that provides the most evidence for its AD association (Table 3, refined). The LOF burden effect size was significantly larger than the missense burden effect size in the SORL1 and we observed similar trends in ABCA7 and ABCA1 (Supplementary Table11). Of note, for ZCWPW1 only the burden of the LOF variants was significantly associated with AD; missense variants are shown for reference purposes (REVEL > 25).Grey: gene was not significantly associated with AD in the meta-analysis.

