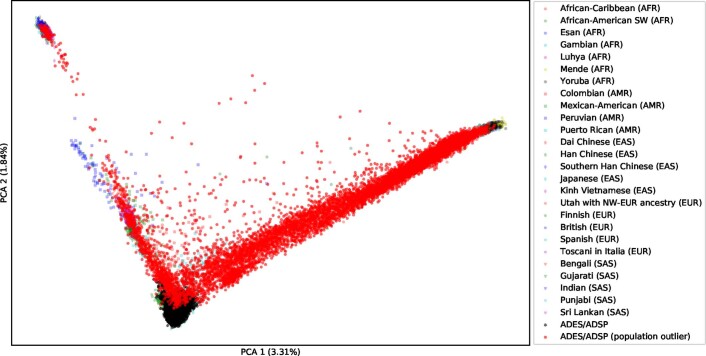
Extended Data Fig. 2. PCA: Sample population compared to 1,000 G population samples.
Sample population compared to 1,000 G population samples. First two PCA components of the study samples used for the Stage 1 and Stage 2 analysis, shown in context of the 1000 Genomes samples for reference (see Supplementary Note section 1.3.4). Samples in red are considered population outliers. Samples with only exome-extracts were not included in this analysis.

