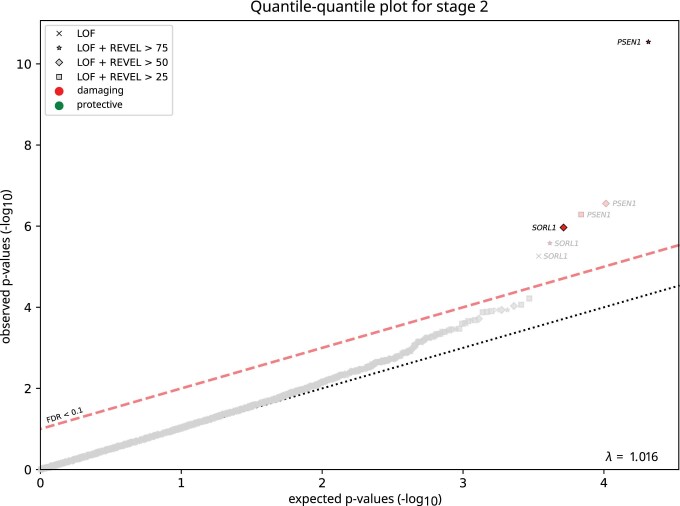
Extended Data Fig. 3. P value inflation in Stage-2 analysis.
P value inflation in Stage-2 analysis: Quantile-quantile plot for Stage-2 (without exome-extract samples), based on a ordinal logistic burden test (see Methods). Results are shown for all burden tests (n = 20,681) for which at least 10 damaging alleles were present in this dataset (based on 4 different variant deleteriousness thresholds per gene). While not used in this analysis, the threshold for multiple testing correction based on FDR < 0.1 is shown for reference. The genomic p-value inflation was 1.016. Note that causative mutations were not separately removed in Stage-2, as we focused on a specific set of genes.

