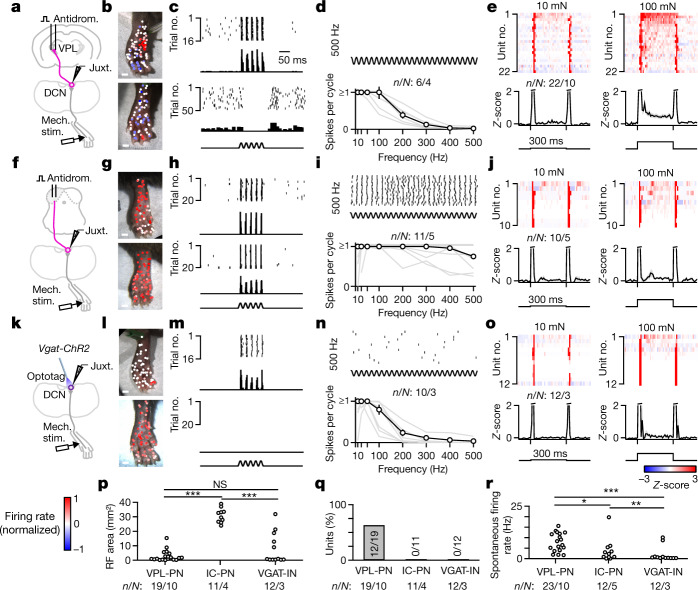
Fig. 1. Tactile features are directed to distinct targets in the somatosensory hierarchy.
a, Schematic of the experiment. Units in the DCN were recorded juxtacellularly (Juxt.) in urethane-anaesthetized mice. Stimulus electrodes were inserted into the VPL, and thalamic PNs (VPL-PNs) were identified through antidromic activation (Antidrom.) and collision testing. Response properties of units were then measured using a mechanical stimulator (Mech. stim.) with a 1 mm probe tip. b, Receptive fields of two different VPL-PNs. Each point is a single trial colour-coded by the normalized firing rate of the unit in response to 100 ms 50 Hz vibration (10–20 mN). c, Example trials from b with a raster and a histogram for two locations of the receptive field for the same unit: excitatory receptive field (top; 1 ms bins) and inhibitory surround (bottom; 10 ms bins). d, Top, Example raster of VPL-PN responses to 500 Hz vibration in the excitatory receptive field. Bottom, Vibration tuning of all VPL-PNs with the mean across units ± s.e.m. (black) and individual units (grey). e, Average responses (Z-scored firing rate) to step indentation in VPL-PN units (top) and mean ± s.e.m. of VPL-PN units (bottom) for 10 mN (left) and 100 mN (right). Mice received 300 ms indentations delivered to the centre of excitatory receptive fields (10 ms bins). f–j, Same as a–e, but for units identified as projecting to the IC. k–o, Same as a–e, but for optotagged local inhibitory interneurons (VGAT-INs). p, Excitatory receptive field (RF) size area for all identified units. Kolmogorov–Smirnov (K-S) test: VPL-PN versus IC-PN, P < 0.001; IC-PN versus VGAT-IN, P < 0.001; VPL-PN versus VGAT-IN, P = 0.4. NS, not significant. q, Percentage of DCN cell types with detected inhibitory surrounds. r, Spontaneous firing rate of all units for each cell type. K–S test: VPL-PN versus IC-PN, P = 0.012; IC-PN versus VGAT-IN, P = 0.008; VPL-PN versus VGAT-IN, P < 0.001. Number of experiments are units/animals (n/N). Scale bars, 1 mm (b,g,l).

