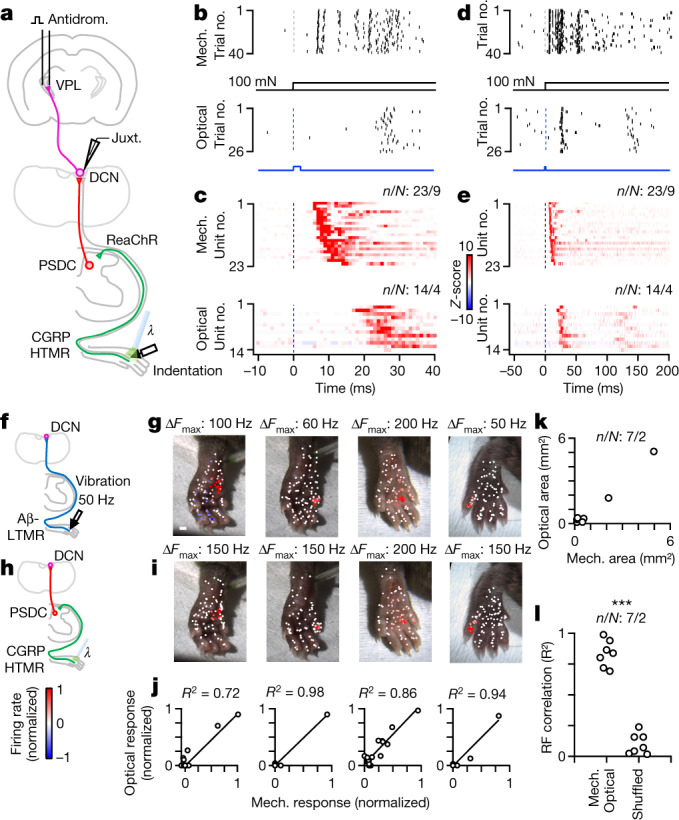
Fig. 4. Somatotopic convergence of the direct and indirect dorsal column pathways onto individual VPL-PNs.

a, Schematic of the experiment. VPL-PNs were identified with antidromic activation in Calca-FlpE;Rosa26FSF-ReaChR animals. Pulses of light activated ReaChR in Calca+ HTMRs in the hindlimb. b, Raster of single VPL-PN unit responses to indentation (100 mN, 1 mm probe tip; top) and responses of the same unit to optical activation (2 ms, 60 mW mm–2) of HTMRs in skin (bottom). c, Histograms for all identified VPL-PNs for mechanical indentation (100 mN, top) and VPL-PN responses to optical activation of HTMRs in the skin (bottom). Shown in 1 ms bins. Z-score colour scale on the right. d–e, Same as b–c, but for a longer timescale. f, Schematic of mechanical (direct) stimulation. A 50 Hz 100 ms vibration (10–20 mN) was applied to different points on the skin for putative VPL-PNs in Calca-FlpE; Rosa26FSF-ReaChR animals. This stimulus activates the direct pathway. g, Vibration receptive field maps for four VPL-PNs. Each point is a single trial colour-coded by its normalized mechanically evoked firing rate. Colour scale on the bottom left. Scale bar, 1 mm. h, Schematic of optical (indirect) stimulation. For the same units in g, light pulses (5 pulses at 0.5 Hz, 2 ms, 60 mW mm–2) were applied to different points on the skin. This stimulus activates the indirect pathway. i, Optical receptive field for same units in g. Each point is a single trial colour-coded by its normalized optically evoked firing rate. j, Correlation of optical and mechanical responses. Each point is the average mechanically and optically evoked responses for a single region of skin. k, Area of optically evoked receptive field compared with the area of mechanically evoked receptive field for single units. Each point is one DCN unit. l, Correlation coefficients (R2) of optically and mechanically evoked receptive fields within individual units or R2 of receptive fields shuffled between units. K–S test: P < 0.001. Number of experiments shown as units/animals (n/N).
