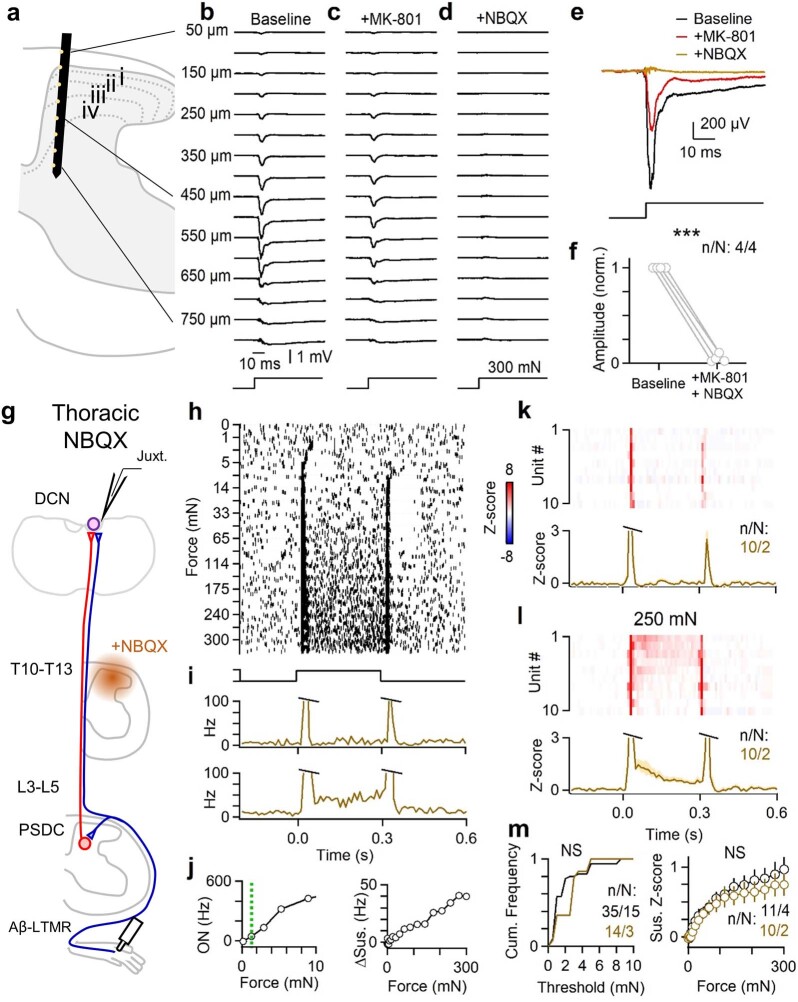
Extended Data Fig. 5. Blockade of glutamatergic transmission suppresses evoked responses locally within the spinal cord.
a–f, A multi-electrode array (MEA) was inserted into L4 spinal dorsal horn, with recording sites facing medially. Field potentials were recorded in response to a 300 mN step applied to the center of the receptive field on the hindlimb. Following baseline trials, MK-801 (10 mM, 10 µL) was applied to the surface of the spinal cord for 3–5 min to block NMDA receptors. The surface was then irrigated with saline and NBQX (10 mM, 20 µL) was applied to block AMPA receptors. a, Schematic of approximate recording location. MEA has 16x2 recording sites spaced 50 µm apart. Only a subset of sites are schematized. b, Field potentials generated at various depths of the spinal cord in response to a 300 mN step indentation under baseline conditions. c, Same recording as in b, but after application of MK-801 to the surface of the spinal cord. d, Same recording as in b and c, but after application of NBQX to the surface of the spinal cord. e, Overlaid field potentials from a 450 µm depth recording site in response to 300 mN indentation, from recording shown in b–d. Responses following NBQX remained suppressed for the remainder of the recording (30 min after NBQX application). f, Summary of change in evoked amplitude. Each marker pair is one animal. (Paired t-test, p < 0.001). g–m, Pharmacological manipulations can have non-specific effects, as drugs may spread from the site of application or enter the body systemically. We assessed these possibilities by applying glutamatergic antagonists to the thoracic cord (T10–T13) to determine whether hindlimb responses in the DCN may be altered through diffusion of the drug to the DCN or non-targeted regions of the spinal cord. A laminectomy was performed over the T10–T13 spinal segments, and the dura was removed. MK-801 (10 mM, 10 µL) was first applied to the surface of the spinal cord for 5 min. The cord was then abundantly irrigated with saline. NBQX (10 mM, 20 µL) was then applied to the surface and gelfoam was placed on top and kept moist with saline. g, Schematic of experimental setup. h, Raster of example DCN unit in response to step indentations of various forces (0–300 mN) in the presence of NBQX applied to T10–T13 spinal segments. i, Histogram of responses to 10 mN (top) and 250 mN (bottom) for unit shown in h-i. j, Left: Max on-response (0–20 ms) vs. indentation force. Dashed green line indicates threshold. Right: Average sustained firing (50–250 ms) vs. force. k, Top: Response of DCN units to 10 mN step indentation in the presence of NBQX. Bottom: Mean ± s.e.m. across DCN units to 10 mN indentation in the presence of NBQX. l, Same as K, but for 250 mN step indentation. m, Left: Mechanical threshold of on-response for units in the presence (brown) or absence (black) of NBQX over T10–T13 spinal segments. Distributions are not significantly different (Kolmogorov-Smirnov test, p = 0.25). Right: Mean ± s.e.m. of sustained firing rate as a function of indentation force across cells in the presence (brown) or absence (black) of NBQX over T10–T13. (Kolmogorov-Smirnov test, p = 0.76). Data shown as n units in N animals (n/N).

