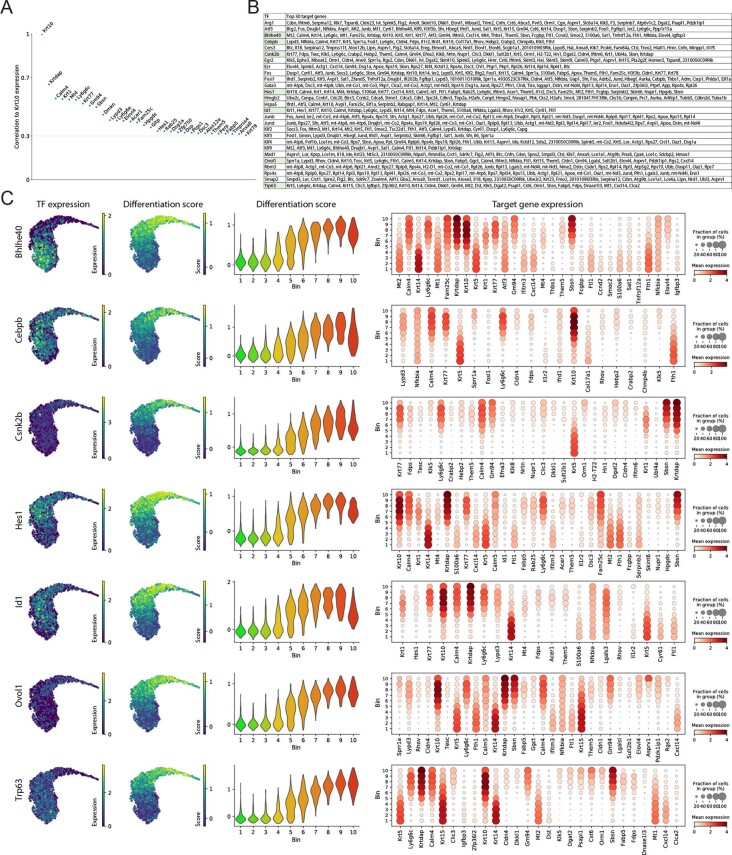
Extended Data Fig. 6. Regulatory network analysis with Scenic.
(A) Genes correlated with Krt10 expression in the early stages of differentiation (bins 2, 3 and 4). Shown are all genes with a pearson correlation > 0.3. (B) Identified transcription factors that target at least one of the Krt10-correlated genes and their corresponding targets (top 30, importance >10). Transcription factors highlighted in green were selected for plotting in (C). (C) Plots showing expression patterns of selected transcription factors and their putative target and/or co-regulated genes from Scenic analysis. Transcription factors were selected by their target gene expression patterns and literature search. Panels show the expression of the transcription factor overlaid on UMAP (left), differentiation-related target gene expression score overlaid on UMAP (middle-left), violinplot of differentiation-related target gene expression score grouped according to differentiation bins (middle-right), and dotplot of top 30 (or all for Cebpb) target gene expression patterns (right). Dot plot genes were ordered according to their importance as a target gene for the transcription factor. Differentiation-related target genes were defined as genes that were not identified as differentially expressed in bin 1. (A-C) plots show integrated results from all biological replicates from all datasets (Joost 2016 n = 19, ITGA6-sorted n = 2, Joost 2020 n = 5 mice).

