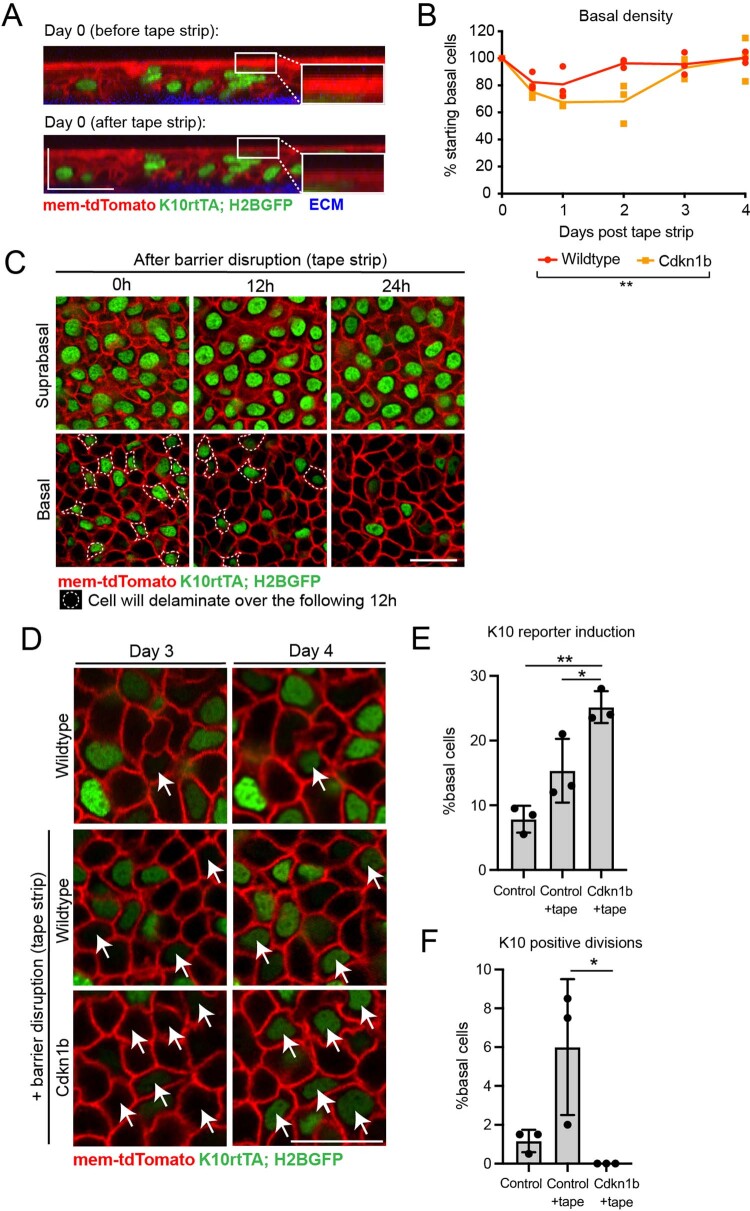
Extended Data Fig. 9. Characterization of control and Cdkn1b tissue after epidermal barrier disruption.
(A) Transverse images of the same epidermal region from the ear of a K10rtTA; pTRE- H2BGFP; mTmG mouse before and directly after tape stripping to disrupt the epidermal barrier. Insets show a close-up view of the epidermal surface before and after removal of the outermost cornified cells, accompanied by visible thinning of mTmG signal. Images are representative of n = 3 mice. (B) Normalized basal cell density within 200 µm × 200 µm regions in the days following tape stripping in control and Cdkn1b mice, normalized to Day 0 values. ANOVA for linear models, F-test p = 0.006742 (C) Revisited basal and suprabasal regions at 0 h, 12 h and 24 h after tape stripping. Dotted lines indicate cells that will delaminate out of the basal layer in the subsequent 12 h. Scale bar = 10 µm. Images are representative of n = 3 mice. (D) Revisited basal regions from Control mice during homeostasis (top row) and Control and Cdkn1b after tape stripping (bottom rows). White arrows indicate new K10 induction events. Scale bar = 10 µm. (E) Proportion of basal cells inducing K10 reporter expression in Control ear skin during homeostasis and Control and Cdkn1b ear skin after tape stripping. Student’s two-sided t-test, p < 0.05 (Control + tape vs Cdkn1b vs tape); p < 0.01 (Control vs Cdkn1b vs tape). Graph represents average of n = 3 imaged mice per condition. (F) Proportion of basal cells undergoing K10 positive divisions Control ear skin during homeostasis and Control and Cdkn1b ear skin after tape stripping. Student’s two-sided t-test, p < 0.05 (Control + tape vs Cdkn1b vs tape), graph represents average of n = 3 imaged mice per condition. For bar graphs in (E) and (F), error bars represent S.D.

