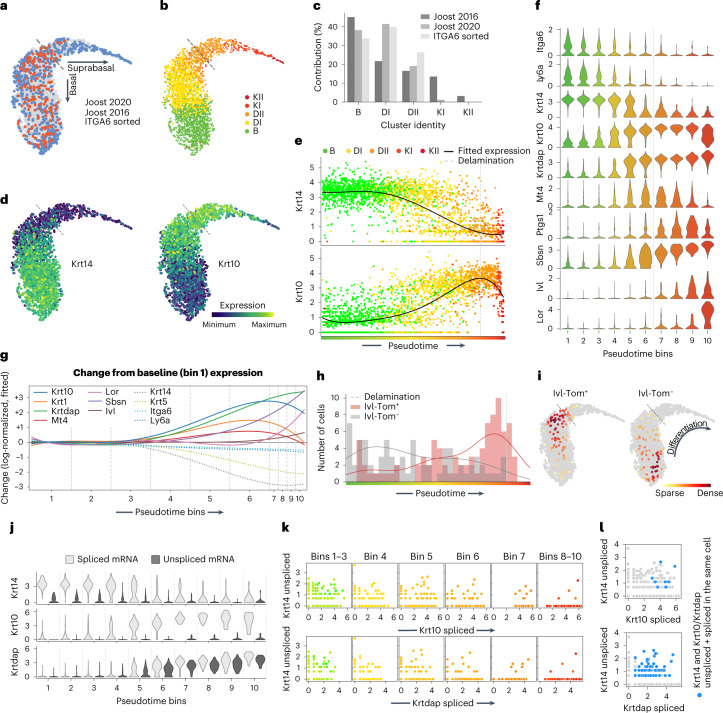
Fig. 2. scRNA-seq trajectory analysis of epidermal stem cell and committed progenitor differentiation.
a, UMAP of the combined epidermal datasets, showing the distributions for Joost 2020 (n = 5 mice), Joost 2016 (n = 19 mice) and ITGA6-sorted (n = 2 mice) cells. The dashed line indicates the assigned delamination point based on the location of 95% of ITGA6-sorted cells (Methods). b, Classification of cells in the combined dataset according to a kNN classifier based on the reference clusters from Joost 2016: basal (B), differentiating (DI and DII) and keratinizing (KI and KII). c, Bar plots showing the contribution of individual datasets to each cluster. d, Krt14 and Krt10 gene expression patterns overlaid on the combined UMAP. e, Krt14 and Krt10 expression (log-normalized) changes for individual cells, as well as fitted expression, ordered along pseudotime and coloured according to their differentiation state from basal (B) to differentiated (DI and DII) to keratinized (KI and KII) as defined in Joost 2016. f, Violin plots of differentiation-associated gene expression within cells grouped into ten pseudotime bins. g, Changes in fitted gene expression levels (log-normalized) of the genes shown in f, as compared with the baseline (average expression in bin 1). Solid and dashed coloured lines indicate genes that respectively increase or decrease their expression as compared with bin 1. The basal–suprabasal border is between bin 6 and bin 7. h, Distribution of Ivl-traced (Tom+) and non-traced (Tom−) cells along the pseudotime (histogram), together with estimation lines for cell density. i, Location of Ivl-traced (Tom+) and non-traced (Tom−) sorted cells on the combined UMAP. Cells are coloured according to the local density of visualized populations. j, Violin plots showing the spliced and unspliced mRNA expression levels (log) for Krt14, Krt10 and Krtdap along the pseudotime bins. k, Scatter plots showing expression (log) of Krt14-unspliced mRNA and Krt10/Krtdap-spliced mRNA, separated into their respective pseudotime bins. l, Scatter plots showing the expression levels (log) of Krt14-unspliced and Krt10/Krtdap-spliced mRNA. Grey cells denote all the cells in the datasets, and blue cells co-express Krt14 and Krt10/Krtdap spliced and unspliced mRNA. In a, b, d–f, h and i, dashed lines indicate the delamination point. In d–f and j–l, Expression is shown as log-normalized counts. Plots show integrated results of all biological replicates from all datasets combined (a–g), ITGA6-sorted cells (h and i) or Joost 2020 dataset cells (j–l).

