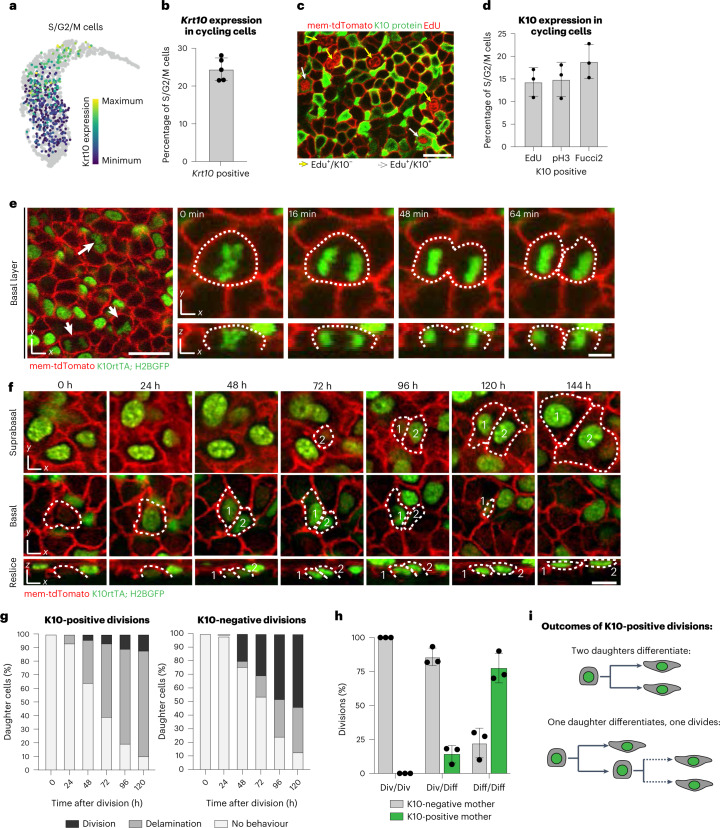
Fig. 3. Differentiation-committed cells proliferate during homeostasis.
a, UMAP showing Krt10 gene expression levels in all cycling (S/G2/M) epidermal cells from the Joost 2020 dataset. b, Quantification of Krt10-positive cells (cut-off 1.84, Methods) within the proliferative cell population (S/G2/M) from the Joost 2020 dataset. Graph represents average of independent experiments from n = 5 mice. c, Representative whole-mount staining of EdU incorporation (red nuclei), K10 (green) and mem-tdTomato (red membrane) showing both EdU-positive, K10-negative (yellow arrows) and EdU-positive, K10-positive (white arrows) basal cells. Scale bar, 20 µm. d, Proportion of actively cycling cells (indicated by EdU, pH3 or Fucci2 mVenus-hGem positivity) that also express K10 protein. Graph represents average from one independent immunostaining experiment using n = 3 mice for each proliferative marker. Error bars indicate s.d. e, Single timepoints (left) or stills from timelapse imaging (right) show K10-reporter-positive (green) mitotic figures, indicated by white arrows (left) or dotted lines (right). Timelapse imaging captures K10 reporter positive divisions generating two basal daughter cells. Membrane is visualized with mem-tdTomato (red). Scale bars, 20 µm (large field of view) or 5 µm (timelapse stills). f, Representative images of a revisited basal cell as it induces K10 reporter expression and divides to produce two daughter cells (numbered 1 and 2) that exit the basal layer. Scale bar, 10 µm. g, Cumulative daughter fates in the first 5 days following K10-reporter-positive and K10-reporter-negative divisions. N = 76 cells from three mice (K10-reporter-positive divisions) and 228 cells from three mice (K10-reporter-negative divisions). h, Quantification of division modes as asymmetric (div/diff), symmetric with both daughters differentiating (diff/diff), or symmetric with both daughters dividing (div/div) from all division events where the subsequent behaviour of both daughters could be resolved in later revisits. Graph represents average of n = 3 imaged mice. i, Schematic of daughter cell fates after K10-reporter-positive divisions. For bar graphs in b, d and h, error bars are mean ± s.d.

