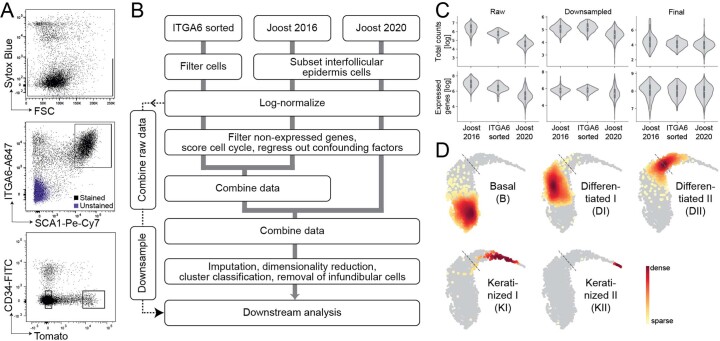
Extended Data Fig. 4. Merging scRNA-seq datasets.
(A) Representative sorting strategy with gates set for live (upper panel), ITGA6 + and SCA1 + (middle panel), and CD34-negative cells according to their Ivl-Tomato expression (lower panel). (B) Flowchart describing the workflow of merging ITGA6-sorted, Joost 2016 and Joost 2020 dorsal skin datasets. Grey lines indicate which steps were performed individually for each dataset and when they were combined. Gene counts for expression analysis were combined from log-normalized counts. (C) Comparison of the total counts per cell and the number of genes expressed per cell for each dataset (Joost 2016 n = 19, ITGA6 sorted n = 2, Joost 2020 n = 5 mice). Only the final dataset genes (highly variable genes present in all datasets) were used for these comparisons. Note that an increase in the number of counts and expressed genes in the final dataset is an expected result of imputation. Y-axis values are shown as natural log. Inner boxplots show the median together with 1st and 3rd quartile, with whiskers denoting the minima and maxima of the distribution. (D) Locations of Joost 2016 cell clusters, overlaid on the combined UMAP, are colored according to local density of cells; all other cells are in grey. Dashed lines indicate the assigned basal-suprabasal border (delamination point).

