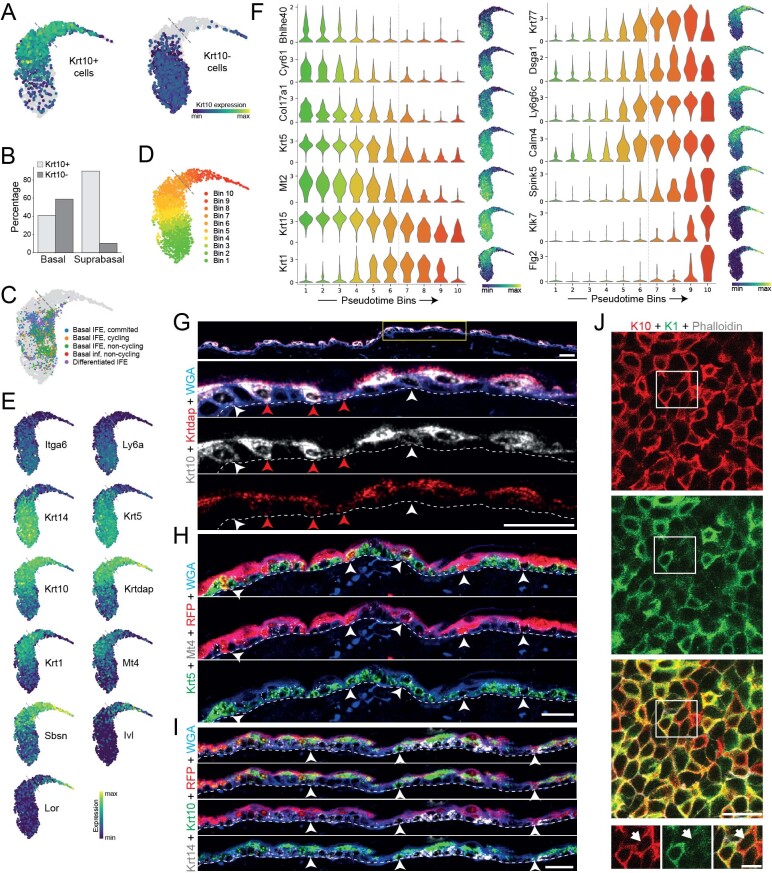
Extended Data Fig. 5. Characterization of the scRNA-seq datasets.
(A) Classification of cells from all datasets as Krt10-positive or Krt10-negative (cutoff: 1.84 log-normalized and downsampled counts, see Methods). Cells are colored according to their Krt10 expression levels. (B) Quantification of Krt10-positive and negative cells within the basal and suprabasal compartments (as defined by the delamination point). (C) Mapping of (Aragona et al., 2020) dorsal IFE dataset (colored) onto our combined UMAP (in grey). Colors indicate cluster annotations from Aragona dataset. (D) UMAP showing the grouping of cells into bins according to their location along the differentiation pseudotime. The basal-suprabasal border was set between bins 6 and 7 (Methods). (E) Expression patterns of genes shown in Fig. 2F, overlaid on the combined UMAP. (F) Violinplots grouped according to pseudotime bins (left panel) and combined UMAPs (right panel) showing characteristic gene expression changes during the differentiation process. Expression levels are shown as log-normalized expression. (G) smRNA-FISH validation of differentiation-associated gene expression in basal dorsal IFE cells. Arrowheads indicate basal cells with Krt10+ /Krtdap+ (red) or Krt10+ /Krtdap− (white) expression. (H-I) smRNA-FISH and antibody-based stainings showing basal Ivl-traced cells (Tom+ stained via RFP) with Krt5 and Mt4 co-expression (arrowheads) (H), and with Krt14 and Krt10 co-expression (arrowheads) (I). (G-I) Cell membranes are stained with WGA (wheat germ agglutinin). Dashed lines indicate the basement membrane. Scale bars = 25 μm. (A, C, D, E, F) Dashed lines indicate the assigned basal-suprabasal border. (J) Representative whole mount staining showing K10 (red) and K1 (green) protein overlap in the basal layer of dorsal epidermis. Cell boundaries are visualized with phalloidin (white). Insets highlight an example of K10 positive, K1 low cells (arrowhead). Scale bar = 25 µm (large field of view) or 10 µm (inset). Images in (G-J) are representative of staining from n = 3 mice. (A-F) Plots show integrated results of all biological replicates from all datasets combined (Joost 2016 n = 19, ITGA6-sorted n = 2, Joost 2020 n = 5 mice) with exception of (C) which includes additional integration of Aragona dataset.

