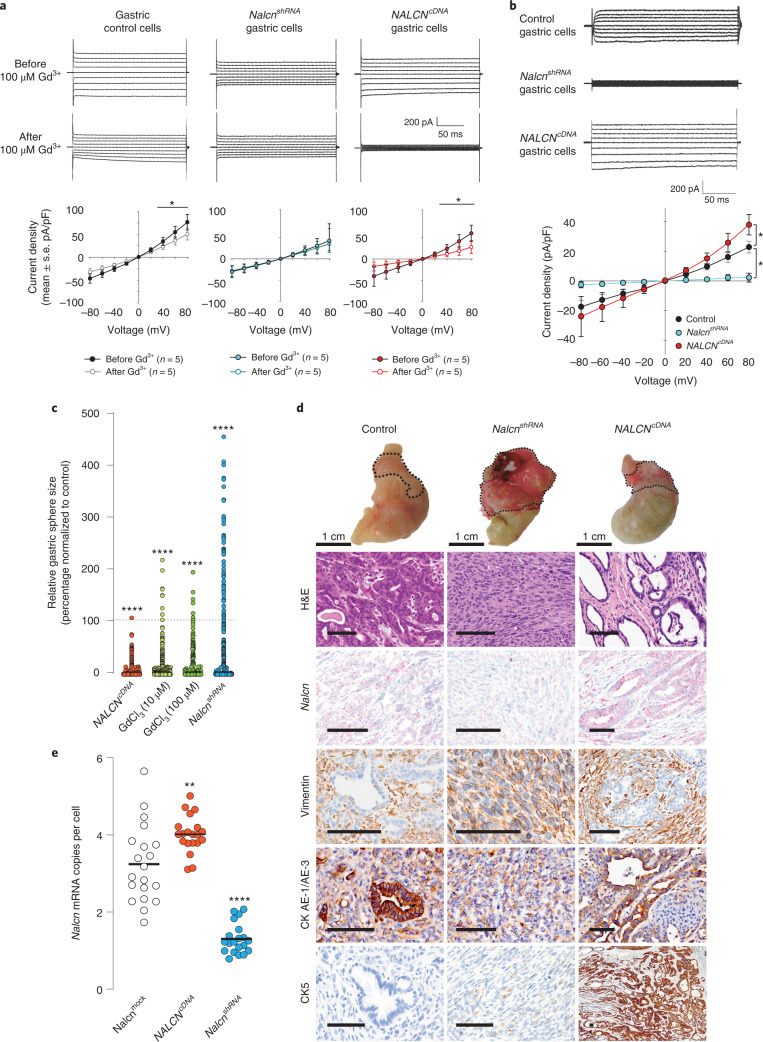
Fig. 2. NALCN regulates P1KP-GAC proliferation and morphology.
a, Current responses to voltage steps from −80 to 80 mV before (upper) and after (middle) addition of 100 μM gadolinium to P1KP-GAC control, NalcnshRNA- and NALCNcDNA-transfected cells, and current density responses to voltage steps before and after 100 μM gadolinium treatment (n = 5 biological replicate cells; values are mean ± s.e.m.). *P values at +40, + 60 and +80 mV for control gastric cells are 0.039, 0.032 and 0.023, respectively. P values at +40, +60 and +80 mV for NALCNcDNA cells are 0.013, 0.013 and 0.003, respectively (paired t-test). b, NALCN-mediated voltage-clamp ion currents from control, NalcnshRNA- and NALCNcDNA-transfected P1KP-GAC cells, and NALCN leak current density (current/cell membrane capacitance, mean ± s.e.m.) in control, NalcnshRNA- or NALCNcDNA-transfected cells (n = 5 cells each, P values comparing peak current at +80 mV voltage step are 0.05 control versus NALCNcDNA cells and 0.023 control versus NalcnshRNA cells; Holm–Sidak multiple comparison procedure). c, Impact of gadolinium treatment (10 µM, n = 386 organoids; 100 µM, n = 264), NalcnshRNA (n = 611) or NALCNcDNA (n = 1,472) transfection on P1KP-GAC organoid size normalized to average P1KP-GAC control treated organoids (P1KP 0 µM, n = 663 organoids, 4.274 ± 0.6238 (s.e.m.); P1KP shRNA control n = 651 organoids, 15.26 ± 2.406 (s.e.m.); P1KP cDNA control n = 583 organoids, 37.65 ± 5.872 (s.e.m.)). ***Exact P < 0.0001, two-tailed Mann–Whitney U-test. d, Representative macroscopic and photomicroscopic images of control (n = 27), NalcnshRNA (n = 21) or NALCNcDNA (n = 22) transduced P1KP-GAC orthotopic allografts. Nalcn RNA expression (in situ hybridization), and stromal (vimentin) and epithelial (CKAE1/AE3, CK7, CK5) marker immunohistochemistry are shown. Scale bar, 100 μm. e, Nalcn mRNA transcripts per tumor cell recorded in 20 individual tumor sections per treatment type. Bar, median. **P = 0.0024, ****P = 0.00006, two-tailed Mann–Whitney U-test.

