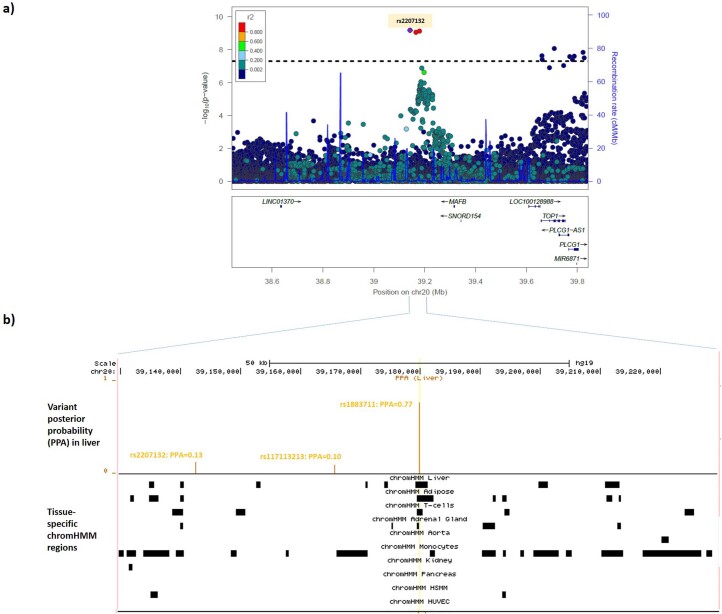
Extended Data Fig. 5. Epigenetically-informed fine-mapping of the MAFB locus.
a, Regional association plot from the CAD meta-analysis for the MAFB region. Colored dots represent the position (x-axis) in GRCh37 coordinates and –log10(meta-analysis P value) (y-axis) of each variant in the region. Dots are shaded to represent the r2 with the lead CAD variant (rs2207132), estimated using a random sample of 5,000 European ancestry participants from the UK Biobank. Recombination peaks are plotted in blue based on estimates of recombination from 1000 Genomes European-ancestry individuals. b, Tissue-specific imputed chromHMM states at the three credible set variants in the MAFB region. The top track shows the position on chromosome 20 (GRCh37) in the MAFB region. The second track shows as orange vertical bars the posterior probability (y-axis) for each variant in the window from the FGWAS fine-mapping, identifying rs1883711 (PPA = 0.77) as the most likely causal variant. The third track indicates as a black box the position of the imputed chromHMM state in each of the ten CAD-relevant tissues based on epigenomic data from the NIH Roadmap Epigenomics Consortium project. The yellow vertical line indicates the position of the most likely causal variant (rs1883711) with respect to the chromHMM states. rs1883711 lies in an enhancer region for liver (the most strongly enriched tissue for this region) and adipose, the two functionally enriched tissues in the region. The other two variants in the 95% credible set (rs2207132 and rs117113213) do not lie in regions annotated as chromHMM states. HSMM, human skeletal muscle myoblasts; HUVEC, human umbilical vein endothelial cells; PPA, posterior probability of being the causal variant.

