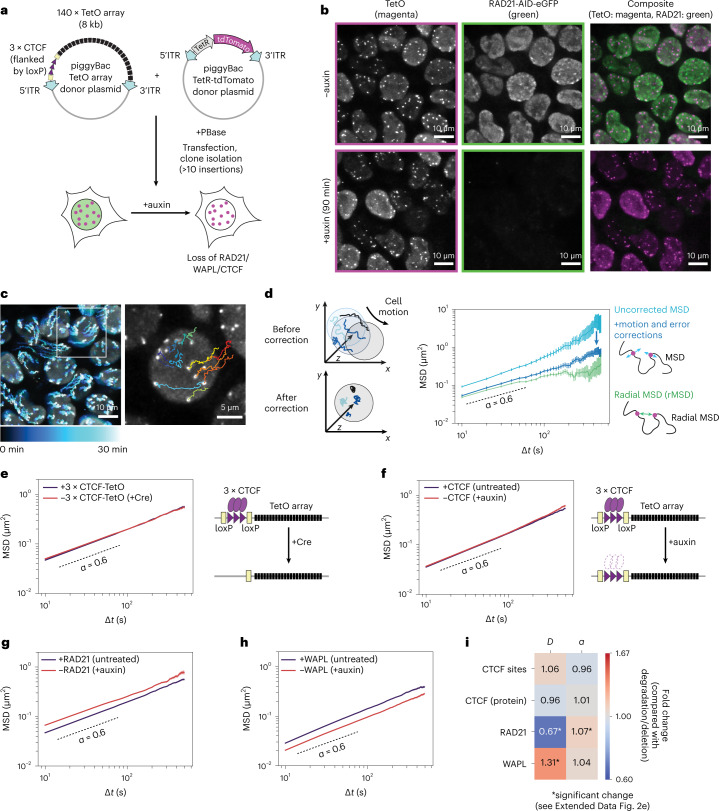
Fig. 1. Cohesin slows down chromosome dynamics in living cells.
a, Clonal mESC lines containing random TetO arrays flanked by 3 × CTCF motifs and expressing TetR-tdTomato. Constructs were integrated using piggyBac transposition in mESCs allowing auxin-inducible degradation of GFP-tagged RAD21, WAPL or CTCF. ITR, inverted terminal repeats. b, Representative images of RAD21-AID-eGFP cells containing 3 × CTCF-TetO imaged before or after 90 min of auxin treatment (exposure time eGFP and tdTomato: 50 ms, deconvolved, maximum intensity projection, bicubic interpolation, n = 3 replicates). c, Left, time series of TetR-tdTomato signal over 30 min (maximum intensity projection, time interval dt = 10 s, color-coded for intensity changes over time). Right, magnification with overlay of TetR-tdTomato signal with reconstructed trajectories of individual TetO arrays. d, Left, cell motion is approximated as the average roto-translational motion of TetO signals within the same nucleus. Right, MSD averaged over trajectories within one nucleus (mean ± s.e.m.) before (cyan, n = 77) and after (blue, n = 77) cell motion and localization error correction. Green, radial MSD of pairs of operator arrays within the same nucleus (mean ± s.e.m., n = 491 pairs). e, Left, MSD (mean ± s.e.m.) in mESC lines before (blue, 310 cells, 13,537 trajectories) or after (red, 271 cells, 11,082 trajectories) Cre-mediated removal of 3 × CTCF sites. Three replicates per cell line and three lines per condition were analyzed and merged here and in all following MSD graphs. P values (two-sided Student’s t-test) for all panels shown in Extended Data Fig. 2e. Right, schematic representation of Cre-mediated removal of CTCF sites. f, Left, same as in e but in mESC lines with 3 × CTCF-TetO arrays, before (blue, 323 cells, 9,829 trajectories) or after (red, 365 cells, 12,495 trajectories) CTCF degradation (6 h of auxin treatment). Right, schematic representation of auxin-induced CTCF degradation. g, MSD (mean ± s.e.m.) of 3 × CTCF-TetO insertions before (blue, 310 cells, 13,537 trajectories) or after (red, 240 cells, 8,788 trajectories) RAD21 degradation (90 min of auxin). h, MSD (mean ± s.e.m.) of 3 × CTCF-TetO before (blue, 336 cells, 6,687 trajectories) or after (red, 350 cells, 6,717 trajectories) WAPL degradation (24 h of auxin). i, Fold changes in generalized diffusion coefficients (D) and scaling exponents (α) in untreated cells compared with cells where degradation of CTCF, RAD21 and WAPL or removal of CTCF motifs (3 × CTCF) occurred.

