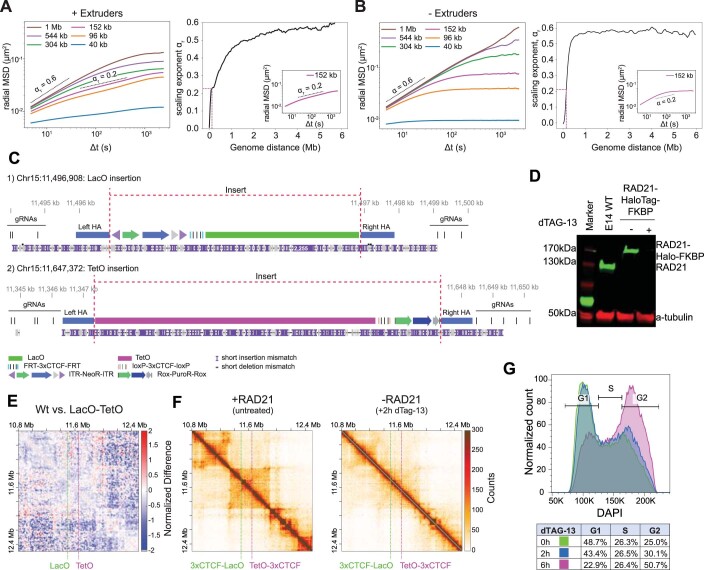
Extended Data Fig. 5. Characterization of TetO and LacO array integrations.
A. Left panel: radial MSD of distances between multiple pairs of monomers separated by distances equivalent to 40 kb - 1 Mb for a polymer with loop extrusion but no barriers. Dashed scaling exponents α = 0.2 and α = 0.6 serve as an eye guide. Right panel: Slopes of radial MSD curves for two loci separated by varying linear distances, estimated from linear fitting between 5 and 60 seconds. Inset: detail of radial MSD and fit for monomers separated by 152 kb. B. Left panel: radial MSD of multiple pairs of monomers separated by various distances (40 kb-1 Mb). Simulations were performed for the polymer without extruders and barriers. Values were averaged with a sliding window without considering the first and last 200 monomers (1.6 Mb). Dashed scaling exponent α = 0.6 serves as an eye guide. Right panel: Distance dependency of the scaling exponent (α) on the genomic distance between loci. C. Integrated Genomic Viewer (IGV) snapshot showing an example of a Nanopore sequencing read mapped to a modified mouse genome including the respective insertions. Reads that spanned from a guide RNA (gRNA) binding site upstream of the left homology arm (left HA) to a gRNA binding site downstream the right homology arm (right HA) confirmed single insertion of the transgene. D. Western Blots showing the targeted degradation of RAD21 after 2 h of treatment with 500 nM dTAG-13. Loading control: anti-tubulin, n = 2 replicates. E. Differential map at 6.4 kb resolution for the structural differences between a E14 wild-type (WT) and the E14 cell line containing LacO and TetO insertions (see Methods). Dashed lines indicate the insertion sites. No structural changes are detected upon integration of the operator arrays. F. Capture-C maps at 6.4 kb resolution in the region on chr15 (10.8 Mb-12.5 Mb) in the untreated cells (left) and in cells treated with 500 nM dTag-13 (left) showing that RAD21 degradation leads to loss of chromosome structure. G. Flow cytometry analysis of fixed cells stained with DAPI to show cell cycle stage distribution of E14 RAD21-HaloTag-FKBP cells.

