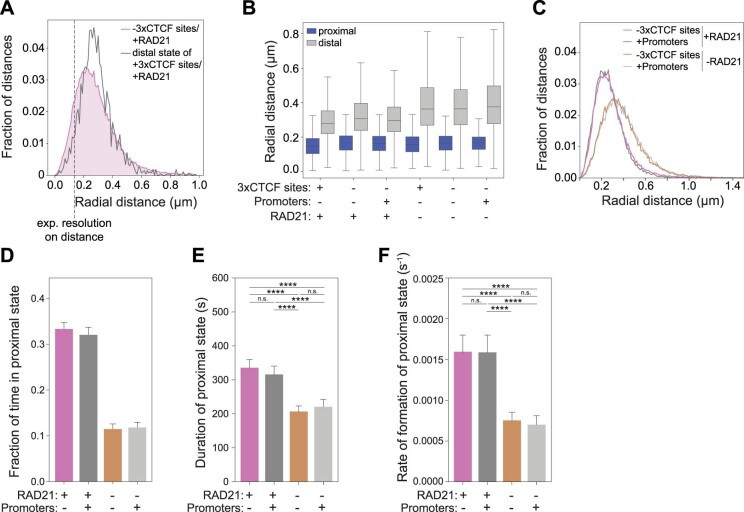
Extended Data Fig. 8. Live-cell imaging of two genomic locations within the same TAD.
A. Radial distance distribution for the condition -3xCTCF sites/+RAD21 (magenta) overlaid with the distal state called by HMM on the +3xCTCF sites/+RAD21 (gray) showing that the distal state identified by HMM largely overlaps with the distance distribution of the two loci in the absence of the CTCF sites. B. Boxplot for the radial distances for the proximal and distal state called by HMM on all six conditions. The horizontal line indicates the median. Box plots are as in Extended Data Fig. 1F. Boxplot: boxes denote lower and upper quartiles (Q1 and Q3, respectively); whiskers denote 1.5x the interquartile region (IQR) below Q1 and above Q3. C. Distribution of TetO-LacO radial distances in the four experimental conditions. −CTCF sites/+RAD21: n = 214 cells examined over 4 replicates, −CTCF sites/−RAD21: n = 277 cells examined over 6 replicates, +Promoters/+RAD21: n = 155 cells examined over 3 replicates, +Promoters/−RAD21: n = 170 cells examined over 3 replicates). D. Fraction of time spent in the proximal state called by HMM in the four experimental conditions comparing +Promoters vs. -Promoters +/−RAD21 (no. of cells is as indicated in panel C). Shown average across experimental conditions and error bars represent bootstrapped (n = 10,000) standard deviations. E. Average duration of proximal states (mean ± 95% confidence interval, n = 680 cells (-promoter +RAD21); n = 466 cells (+promoter +RAD21); n = 268 cells (−promoter −RAD21); n = 253 cells (+promoter −RAD21)) for the conditions +Promoters vs. −Promoters, +/−RAD21. p-values (two-sided Kolmogorov-Smirnov): * – p < 0.05, ** – p < 0.01, *** – p < 0.001, **** – p < 0.0001. p-values can be found in Suppl. Table S2. F. Average rates of contact formation – time elapsed between the end of a proximal state and the beginning of the next (mean ± 95% confidence interval, n = 726 (-promoter +RAD21); n = 495 (+promoter +RAD21); n = 323 (−promoter −RAD21); n = 296 (+promoter −RAD21))) for the conditions +Promoters vs. −Promoters, +/−RAD21. p-values legend is as in panel E.

