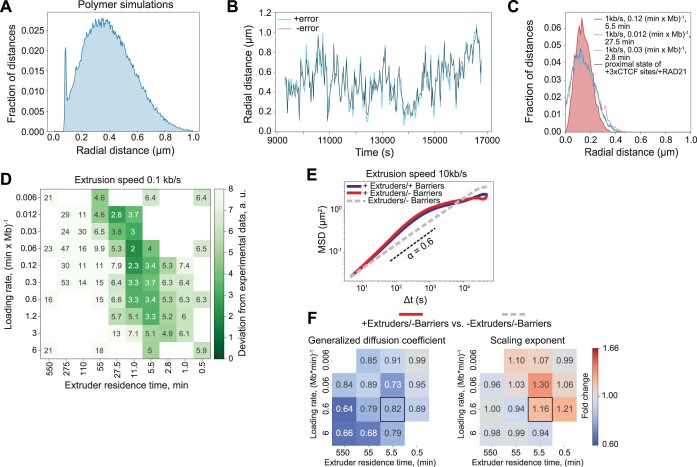
Extended Data Fig. 9. HMM analysis of simulations compared to experimental data.
A. Bimodal distribution of pairwise distances from simulations corresponding to the set of parameters with a loading rate of 0.06 (min × Mb)−1, extruder residence time of 5.5 min, extruder speed of 1 kb/s, and in the absence of barriers. Data were sampled every 1 s and merged from 10 simulation runs. B. Representative radial distance trajectory of a simulated system with and without an additional error on the distance that is in the range of the experimental error. C. Radial distance distribution for the proximal state of the +3xCTCF sites/+RAD21 condition overlaid with the distributions of the proximal states from the three best matching parameters sets when comparing only the average radial distances. D. Heatmap showing the agreement of all simulated systems (for extrusion speed 0.1 kb/s) with the experimental data. The score is as described in Fig. 6A (see Methods). E. MSDs for three conditions for extruder residence time of 5.5 min, loading rate of 0.6 (Mb × min)−1 and extrusion speed of 10 kb/s. Pairwise comparison for conditions indicated in the title of each pair of heatmaps. F. Heatmap showing the fold change of generalized diffusion coefficients (D) and scaling exponent (α), and represents fold change between the conditions.

