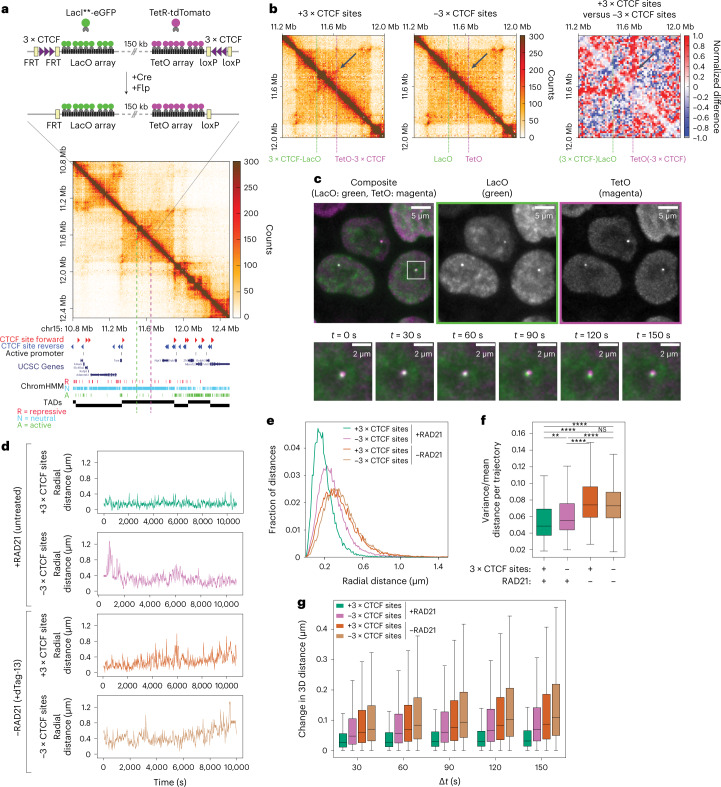
Fig. 4. Cohesin and CTCF reduce variability in chromosome folding dynamics.
a, Top, insertion of TetO and LacO arrays separated by 150 kb within a ‘neutral’ TAD on chromosome 15 in mESCs. Flanking 3 × CTCF sites can be excised by Cre and Flp recombinases. Arrays are visualized by binding of LacI**-eGFP and TetR-tdTomato, respectively. Bottom, tiled Capture-C map (6.4-kb resolution) and genomic datasets in mESCs in a region in 2.6 Mb surrounding the engineered TAD. Capture-C was performed in cells where arrays were flanked by 3 × CTCF sites. Dashed lines, positions of LacO and TetO insertions. b, Capture-C maps in mESC lines with (left) or without (middle) 3 × CTCF sites flanking TetO and LacO arrays, and differential map (right, +3 × CTCF versus −3 × CTCF, Methods) highlighting interactions formed between convergent 3 × CTCF sites (arrows). c, Top, representative fluorescence microscopy images of mESCs with 3 × CTCF-LacO and TetO-3 × CTCF insertions. Bottom, magnified view with time series overlay of LacI**-eGFP and TetR-tdTomato signals (exposure time 50 ms, deconvolved, maximum intensity projection, bicubic interpolation). d, Representative trajectories of TetO-LacO radial distances with or without convergent 3 × CTCF sites, either before or after degradation of RAD21 (2 h of dTag-13) (dt = 30 s). e, Distribution of TetO-LacO radial distances in the four experimental conditions (+3 × CTCF sites/+RAD21: n = 152 cells, 4 pooled replicates; −3 × CTCF sites/+RAD21: n = 214 cells, 4 pooled replicates; +3 × CTCF sites/−RAD21: n = 248 cells, 7 pooled replicates; −3 × CTCF sites/−RAD21: n = 277 cells, 6 pooled replicates). f, Distributions of variance over mean within single trajectories across the four experimental conditions (no. of cells as in panel e). Boxes, lower and upper quartiles (Q1 and Q3, respectively). Whiskers denote 1.5 × interquartile region (IQR) below Q1 and above Q3. P values are calculated using two-sided Kolmogorov–Smirnov test. NS, not significant; **P < 0.01; ****P < 0.0001. Exact P values can be found in Supplementary Table 2. Outliers are not shown. g, Distribution of jump step size (changes in TetO-LacO radial distance) across increasing time intervals for the four experimental conditions (no. of cells as in panel e). Boxes, lower and upper quartiles (Q1 and Q3, respectively). Whiskers, 1.5 × IQR below Q1 and above Q3. Outliers are not shown.

