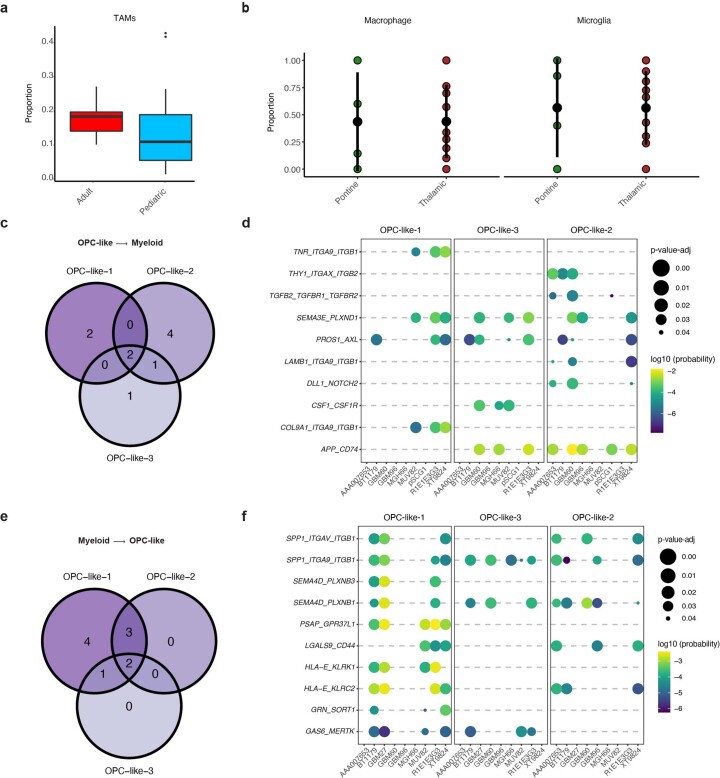
Extended Data Fig. 5. The myeloid cell landscape of H3-K27M DMGs.
(a) Boxplot depicting TAM proportions in all tumor and normal cells profiled by scRNA-seq and grouped by adult and pediatric sample groups across N = 16 biologically independent samples. The median is marked by the thick line within the boxplot, the first and third quartiles by the upper and lower limits, and the 1.5x interquartile range by the whiskers. (b) Distributions (mean values + /− 2xSEM) of macrophage and microglia proportions within TAMs across N = 16 pontine and thalamic tumors. (c) & (e) Venn diagram depicting shared and specific OPC-like-to-myeloid (c) and myeloid-to-OPC-like (e) ligand-receptor interactions between different OPC-like subpopulations. (d) & (f) Ligand-receptor interactions assessed for each OPC-like subpopulation for OPC-like-to-myeloid (d) and myeloid-to-OPC-like (f) interactions. Color scale depicts probabilities of interaction, while dot size denotes Benjamini-Hochberg (BH)-corrected p-values from a two-sided permutation test.

