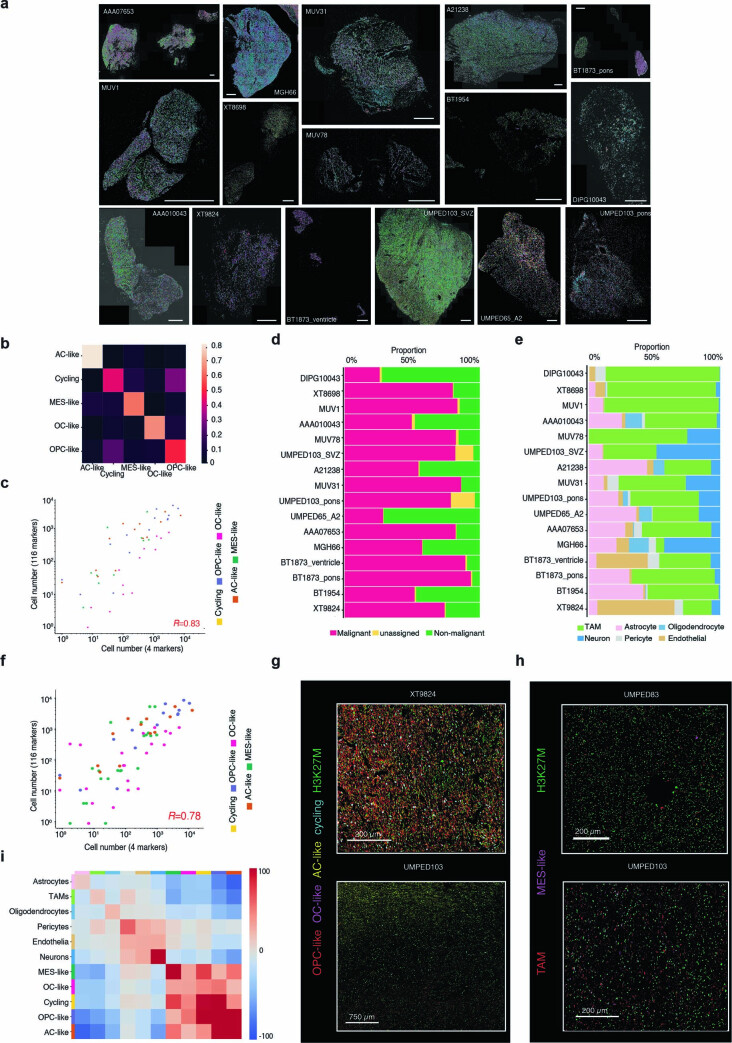
Extended Data Fig. 6. The single-cell spatial transcriptomic architecture of H3-K27M DMGs.
(a) Representative HybISS gene maps for 16 H3-K27M tumors (1 experiment/tumor over the entire image section with 100-20,000 cells profiled/tumor). Scale bar corresponds to 100 µm in all panels. (b) Confusion matrix of pciSeq derived tumor cell state scores for all samples. The color scale represents the mean probability assigned to a cell when a specific cell state is predicted. Higher values indicate a more probable prediction. (c) Scatter plot representing numbers of malignant cells assigned to a cell state (color scale) for each sample (dot), as inferred from pciSeq based on 116 marker genes (y-axis) or on the 4 best markers (x-axis). The Pearson correlation coefficient between both marker sets is shown in red. (d) Sample-level proportions (x-axis) of malignant and non-malignant cells (color legend) across 16 tumors (y-axis) profiled by HybISS as assessed by anti-H3.3K27M IF. (e) Sample-level proportions (x-axis) of non-malignant cell types (color legend) assigned by HybISS for the 16 H3-K27M DMGs (y-axis). (f) Scatter plot representing numbers of malignant cells assigned to a specific cell state (color scale) for each sample profiled (dot), as inferred from pciSeq based on 116 marker genes (y-axis) or on selected IF markers (PDGFRA, BCAS1, GFAP, CD44/CD63) (x-axis). The Pearson correlation coefficient between both marker sets is shown in red. (g) & (h) Representative multiplexed IF (CODEX) images, showing spatially distinct subpopulations of malignant (marker: H3-K27M) OPC-like (marker: PDGFRA), OC-like (marker: BCAS1), AC-like (marker: GFAP), and proliferating cells (marker: Ki67) in (g), and of MES-like (marker: CD44/CD63) and myeloid cells (marker: IBA1) in (h). For each tumor, one experiment was performed with ~70,000-1.2 million individual cells profiled per sample over the entire tissue section. (i) Neighborhood enrichment analysis between all malignant and non-malignant cell populations, identified at 50 μm. The color scale denotes the probability of finding a cell when a second cell type is present divided by the probability of finding the second cell type.

