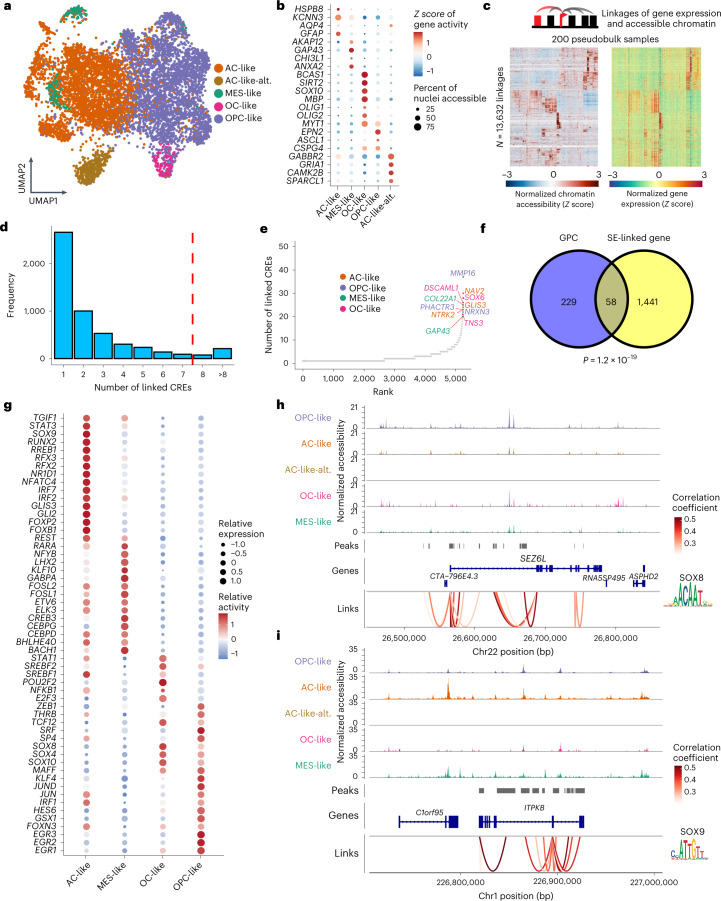
Fig. 4. Characteristic chromatin profiles of H3-K27M DMG cell populations.
a, UMAP of all snATAC-seq derived tumor nuclei after batch effect correction, highlighting de novo assigned clusters. b, Dotplot representation of top marker genes with differential gene activities (color scale) and proportion of nuclei accessible (dot size) within snATAC-seq derived cell states. c, Heatmap showing normalized chromatin accessibility and gene expressions of 13,632 substantially linked CRE-gene pairs (left rows, chromatin accessibility; right rows, linked gene expressions). Rows were clustered using hierarchical clustering. For visualization, 5,000 rows were randomly selected. d, Barplot representing distribution of numbers of linked CREs per gene. Red dashed line denotes the top 5% threshold of numbers of linked CREs that define GPC. e, Ranking of genes (x axis) by numbers of linked CREs (y axis) highlighting genes with top 20 linked CREs in color. Genes differentially expressed in a tumor cell state or identified as a cell state-specific TF regulon by SCENIC are colored according to the legend. f, Venn diagram representing overlap of GPCs with H3-K27M DMG super-enhancer associated genes, identified by Nagaraja et al.19. P value of a two-sided hypergeometric test is shown. g, Dotplot of integrative TF analysis representing the top cell state (columns)-specific TFs (rows). Average relative expression level assessed by scRNA-seq is depicted by dot size, and relative activity inferred by SCENIC analysis is presented by color scale. h,i, Integrative representation of gene loci of the h, OPC-like cell-specific SEZ6L gene, and i, AC-like cell-specific ITPKB gene. At the top, pseudobulk chromatin accessibility track plots are shown colored by cell type. In the middle row, bars depict the locus of putative CREs. In the bottom row, loops denote the correlation between chromatin accessibility of each peak and expression of its linked gene, representing putative CREs that are enriched for the OPC-like cell-specific SOX8 (h), AC-like cell-specific SOX9 (i), TF motifs, respectively.

