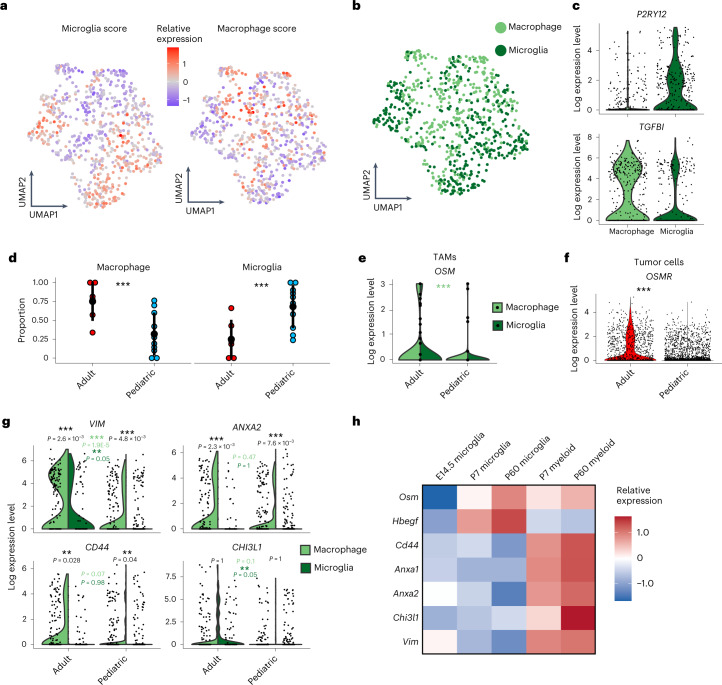
Fig. 5. The myeloid cell landscape of H3-K27M DMGs.
a, UMAP of TAMs analyzed by scRNA-seq, color scaled by expression scores for microglia and macrophage gene sets. b, UMAP of TAMs colored by classification as macrophage or microglia cell type. c, Violin plot depicting log normalized expression levels of representative microglia and macrophage marker genes across TAMs scored as either microglia or macrophage. d, Dotplots representing the distribution (mean ± 2 × s.e.m.) of assigned macrophage versus microglia proportions across adult and pediatric tumors (N = 16 biologically independent samples). Three asterisks denote credible statistical changes determined by a Bayesian scCODA model with FDR < 0.05 and without multiple test corrections. e, Violin plots of log normalized expression levels of OSM gene in adult and pediatric TAMs. Three asterisks denote P = 0.003 (two-sided Kolmogorov–Smirnov test). Three asterisks in light green represent comparisons between adult and pediatric tumors for macrophages. f, Violin plots of log normalized expression levels of OSMR gene in adult and pediatric tumor cells. Three asterisks denote P = 0 (two-sided Kolmogorov–Smirnov test). g, Violin plots of log normalized expression levels of MES-like marker genes in adult and pediatric TAMs. P values from different comparisons are shown (two-sided Kolmogorov–Smirnov tests; black: within age-group comparisons between macrophages and microglia; light green: adult versus pediatric macrophages; dark green: adult versus pediatric microglia). h, Heatmap representation of scaled relative expressions (color scale) of MES-like state-associated ligands and marker genes (rows) in a single-cell atlas of normal mice microglia and brain myeloid cells across different age groups (E14.5, P7, P60)52 (columns).

