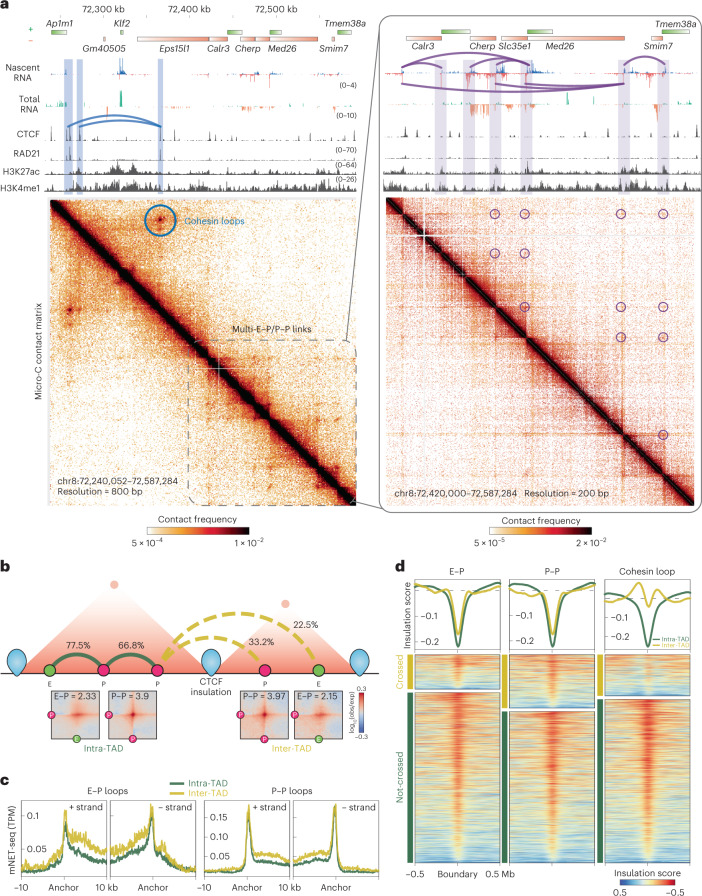
Fig. 2. E–P/P–P loops can cross TAD boundaries.
a, Snapshots of Micro-C maps of an ~300-kb region plotted with 800-bp resolution (left) and an ~150-kb region plotted with 200-bp resolution (zoomed-in, right). Micro-C data are reanalyzed from our previous study9. The standard heatmap shows the gradient of contact intensity for a given pair of bins. This color scheme is used for Micro-C maps throughout the manuscript. Contact maps are annotated with gene boxes and 1D chromatin tracks show the signal enrichment in the same region. Features such as cohesin loops (blue arched lines and circles) and E–P/P–P loops (purple arched lines and circles) enriched at stripe intersections are highlighted. The CTCF and cohesin ChIP-seq peaks show strong contact signals between the Ap1m1 and Eps15l1 genes (blue arched lines and circle), which insulate the Klf2 gene from communicating with regions outside the loop domain. However, multiple weak interactions within the downstream 150-kb region around the Med26 gene still occur without apparent cohesin residency at their anchors (purple arched lines and circles), and these contacts sharply correlate with nascent transcription signals at promoters and enhancers. b, Schematic (top) showing two adjacent TADs insulated by CTCF boundaries and E–P/P–P interactions either within a TAD (intra-TAD, solid arched line) or across TADs (inter-TAD, dashed arched line). E–P/P–P contact intensity was quantified with the Micro-C data at 2-kb or 4-kb resolution. TADs called by Cooltools and Arrowhead returned similar results for the ratio of boundary-crossing E–P/P–P (see Methods). APA (bottom) is plotted for paired E–P/P–P that either cross (inter-TAD) or do not cross (intra-TAD) a TAD boundary. c, Nascent transcription (± strand) at the loop anchors of intra- (green) or inter-TAD (yellow) E–P/P–P loops. TPM, transcripts per million. d, Heatmap and histogram profile of insulation scores at 20-kb resolutions spanning the 1-Mb window for intra- (green) or inter-TAD (yellow) E–P/P–P loops. Color map shows strong insulation in red and weak insulation in blue in log10.

