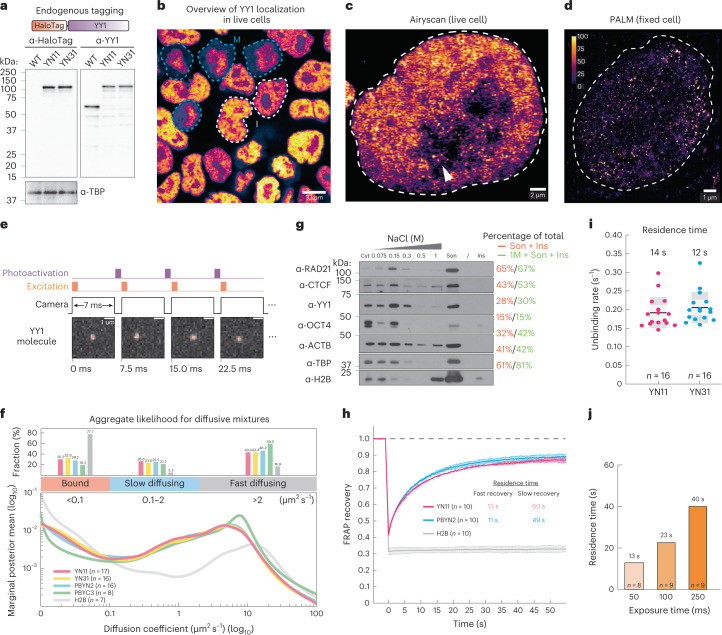
Fig. 6. YY1 binding dynamics.
a, Endogenously tagging YY1 with HaloTag and YY1 and TATA-box-binding protein (TBP) western blots. HaloTag is covalently conjugated with cell-permeable dyes for single-molecule imaging in live cells. b, HaloTag-YY1 live-cell confocal imaging after staining with 500 nM TMR Halo ligand. The white dashed lines show interphase cells and the blue dashed lines mitotic cells. Scale bar, 10 μm. c, YY1 Airyscan-resolved, live-cell confocal imaging (n = 13). The arrow shows sporadic loci within the nucleolus. Scale bar, 2 μm. d, YY1 PALM imaging (n = 30). The color map shows signal ranging from 0 to 100. Scale bar, 1 μm. e, The spaSPT illumination pattern and representative YY1 raw images with tracking overlaid. HaloTag-YY1 molecules were detected and tracked to form trajectories. The SASPT analysis package infers diffusion coefficient distributions from spaSPT data. Two major apparent diffusion states are a bound population (diffusion coefficient Dbound < 0.1 µm2 s−1) and a mixture of freely diffusing molecules (Dfree > 0.1 µm2 s−1), which can be separated further into slow (Dslow ~0.1–2 µm2 s−1) and fast moving (Dfast > 2 µm2 s−1). Scale bar, 1 μm. f, Aggregate likelihood of diffusive YY1 molecules. Top, bar graph showing fractions of YY1 binned into bound, slow- and fast-diffusing subpopulations. Bottom, YY1 diffusion coefficient estimation by regular Brownian motion with marginalized localization errors. g, Western blots of cytoplasmic (Cyt) and nuclear proteins dissociating from chromatin at increasing salt concentrations (Extended Data Fig. 2b). A subpopulation (~30%) of YY1 stays on chromatin, resisting 1 M washes. Ins, insoluble pellet after sonication; Son, sonicated, solubilized chromatin. Percentage of total shows the signal intensity of the indicated fractions divided by the total signal intensity. Anti-histone 2B controls for chromatin integrity during fractionation. h, FRAP analysis of YY1 bleached with a square spot. Error bars are fitted curve ± s.e.m. with 95% CI. i, Slow-SPT measuring YY1 residence time. Individual molecules were tracked at 100-ms exposure time to blur fast-moving molecules into the background and capture stable binding. The unbinding rate is obtained by fitting a model to the molecules’ survival curve. Each datapoint indicates the unbinding rate of YY1 molecules in a single cell. The box plot shows quartiles of data. Error bars are mean ± s.d. j. Slow-SPT measures YY1’s residence time at multiple exposure times.

