Fig. 4.
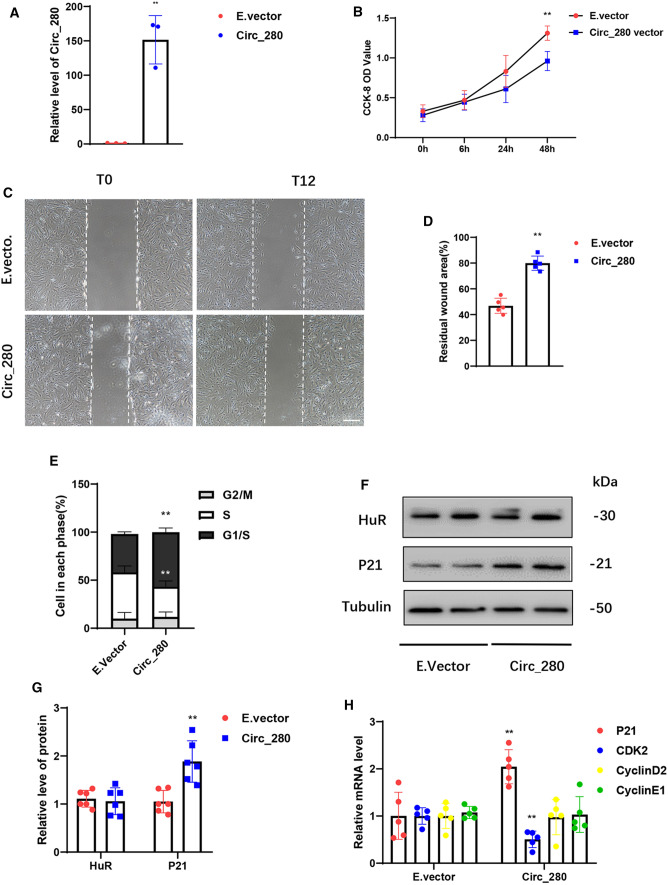
Biological effects of hsa_circ_0000280 determined by gain-of-function assays in HASMCs. A Expression of hsa_circ_0000280 elevated by plasmid overexpression (n = 3, p = 0.0018; Student t test). B HASMC cell proliferation determined using CCK8 assays. X-axis: duration of hsa_circ_0000280 stimulation by plasmid (n = 3, compared with 0 h, p = 0.0058; Student t tests). C, D Wound assays of hsa_circ_0000280-elevated HASMCs. Graph shows quantified residual wounded area at 12 h post-scratch vs. empty vector (E.vector) controls. (n = 5, p < 0.0001; Student t tests) Scale bar, 100 μm. E Cell cycle assays of HASMCs incubated with exogenous hsa_circ_0000280 vs. E.vector controls (n = 3, p < 0.05; Student t tests). F, G Western blots of ELAVL1 and CDKN1A in hsa_circ_0000280-elevated HASMCs vs. E.vector controls (n = 6, p = 0.0019; Student t tests). H Expression of CDKN1A, CDK2, CCND2, and CCNE1 determined by qPCR in hsa_circ_0000280-elevated HASMCs vs. E.vector controls (n = 5, p < 0.01; Student t tests). Data are presented as means ± SD

