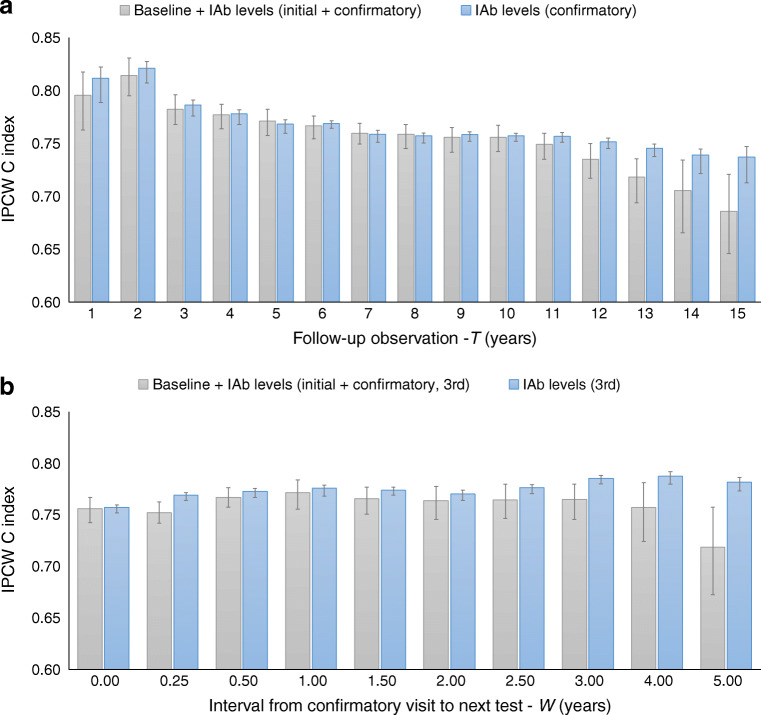
Fig. 2.
Comparison of type 1 diabetes prediction performance (IPCW concordance index [C index] with 95% CI) for two models. The first model (blue) used only the most recent IAb levels at the prediction start time (‘time 0’); the second model (grey) added baseline covariates and IAb levels from the initial and confirmatory visits to the most recent IAb levels. (a) Performance for various follow-up periods (T) ranging from 1 to 15 years. The prediction start time (‘time 0’) was the seroconversion confirmatory visit. (b) Performance for various test intervals (W) ranging from 0.25 to 5 years (W=0 is the confirmatory visit). In this analysis, the prediction time point (‘time 0’) was the time of the third visit (confirmatory visit+W). The follow-up period starts from the prediction time point and was fixed at 10 years

