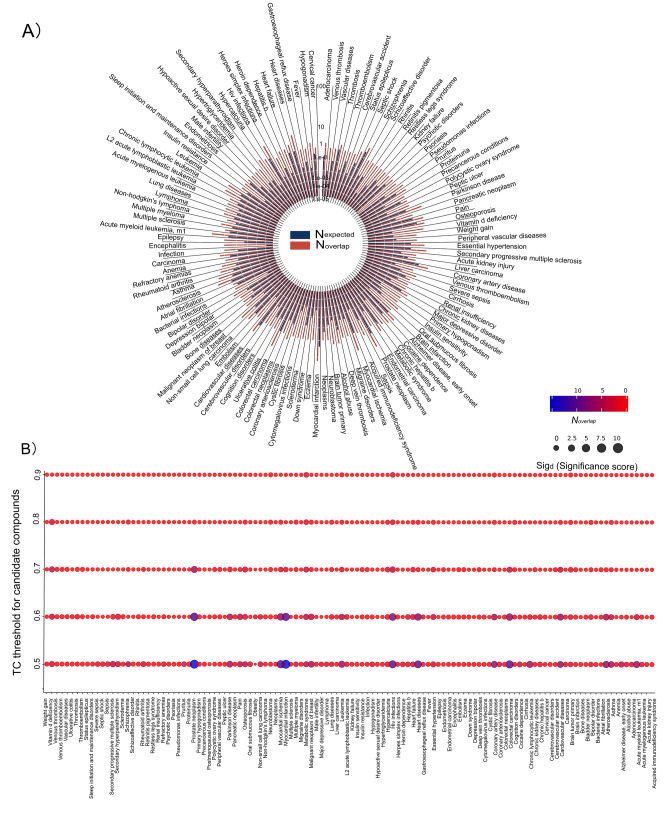
Figure 3.
(A) The circular bar shows drug repurposing results matched with CTD. All the matched diseases were distributed as pie in the circle. The blue bars represent ) the expected number of compounds, if chosen randomly while the red bar represents the actual overlap (Noverlap) between compounds in CTD and DrugRepo. (B) The Significance scores at different TC thresholds (with Y-axis as thresholds and X-axis as a disease whose true positive is not 0). The significance score is represented by dot size, and the colour from red to blue represents number of overlapping compounds.

