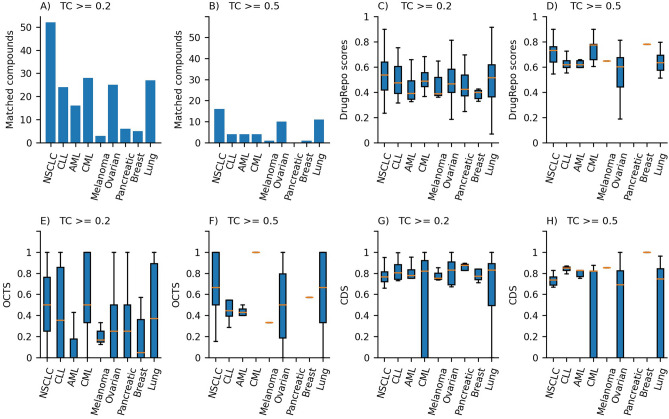
Figure 6.
(A) The number of matched candidate compounds across nine cancer types using structural similarity (TC) ≥ 0.2, (B) Number of matched candidate compounds using structural similarity (TC) ≥ 0.5, (C) Distribution of DrugRepo scores for matched compounds for structural similarity (TC) ≥ 0.2, (D) Distribution of DrugRepo scores for matched compounds for structural similarity (TC) ≥ 0.5. (E) Distribution of compound-disease score for repurposed compounds TC ≥ 0.2, (F) Distribution of compound-disease score for repurposed compounds TC ≥ 0.5, (G) Distribution overlapping target profile scores between approved and repurposed compounds TC ≥ 0.2, (H) Distribution overlapping target profile scores between approved and repurposed compounds TC ≥ 0.5.

