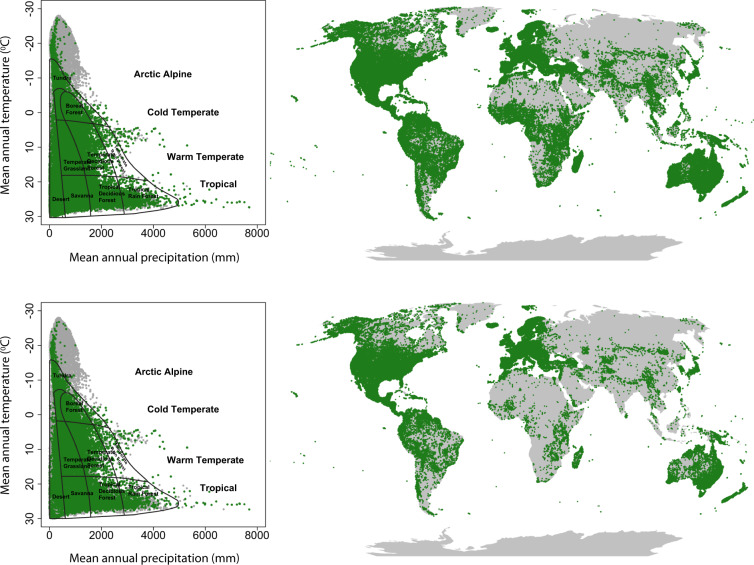
Fig. 2.
Climatic and geographical coverage of the dataset. Green points, occurrences according to the Global Biodiversity Information Facility (GBIF) (http://www.gbif.org) of species with information on at least one core trait (upper panels) and all six core traits (lower panels). Right panels show distribution in the global map (Robinson projection); grey: land surface. Maps are based on the R package ‘maps’, accessed at The Comprehensive R Archive Network (https://cran.r-project.org/web/packages/maps/index.html). Left panels show distribution in major climatic regions of the world; grey: MAP and MAT as in Climate Research Unit (CRU) CL v.1.0 0.5 degree climatology (http://www.cru.uea.ac.uk/data, ref. 245); Biome classification according to Whittaker246. This figure is reproduced from ref. 9 with permission.

