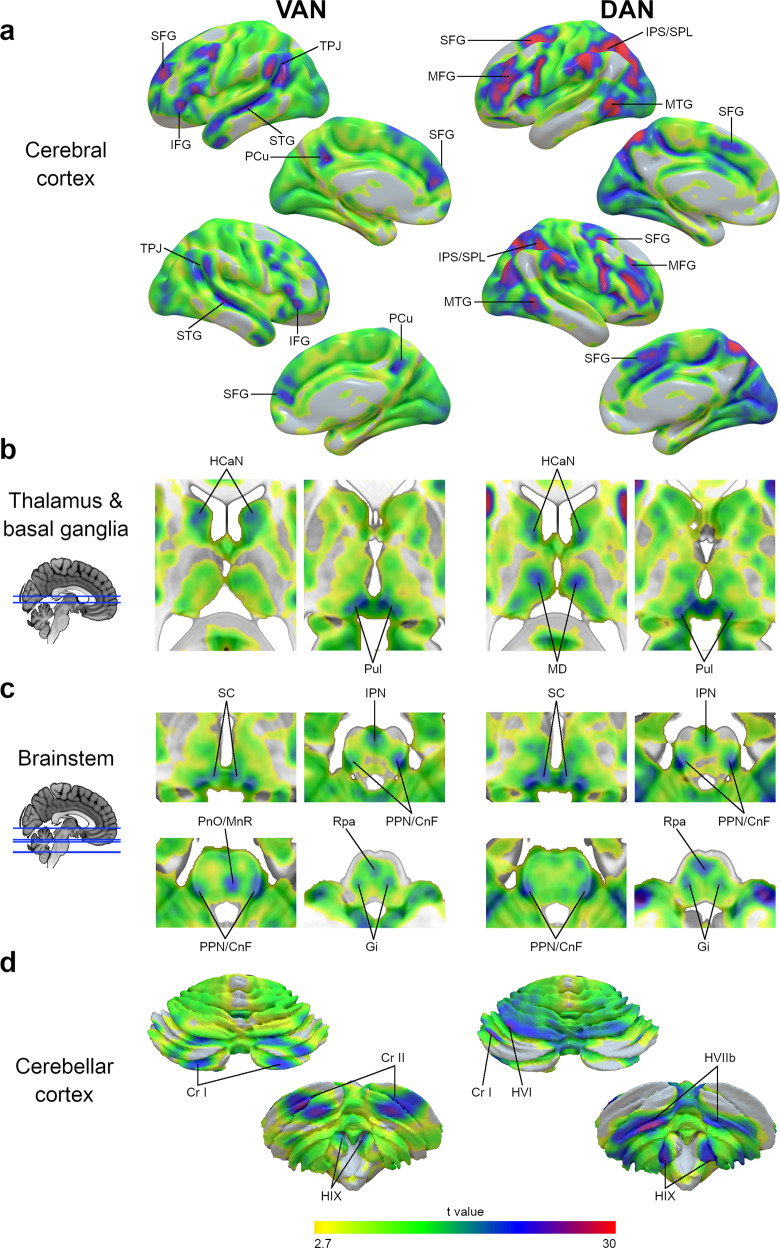
Fig. 1. VAN and DAN maps after functional alignment.
VAN (left) and DAN (right) maps after functional alignment at different anatomical levels, namely the cerebral cortical surface (a), subcortical thalamus and basal ganglia (b), brainstem (c), and cerebellar cortical surface (d). The color gradient represents the t-value distribution (n = 110). CnF cuneiform nucleus, Cr I cerebellar crus I lobule, Cr II cerebellar crus II lobule, DAN dorsal attention network, Gi gigantocellular nucleus, HCaN head of caudate nucleus, HIIb cerebellar lobule IIb, HVI cerebellar lobule VI, HIX cerebellar lobule IX (cerebellar tonsils), IFG inferior frontal gyrus, IPN interpeduncular nucleus, IPS intraparietal sulcus, MnR median raphe nucleus, MD mediodorsal nucleus of the thalamus, MTG middle temporal gyrus, PCu precuneus, PnO nucleus pontis oralis, PPN pedunculopontine nucleus, Pul pulvinar, Rpa raphe pallidus nucleus, SC superior colliculus, SFG superior frontal gyrus, SPL superior parietal lobule, STG superior temporal gyrus, TPJ temporoparietal junction, VAN ventral attention network.

