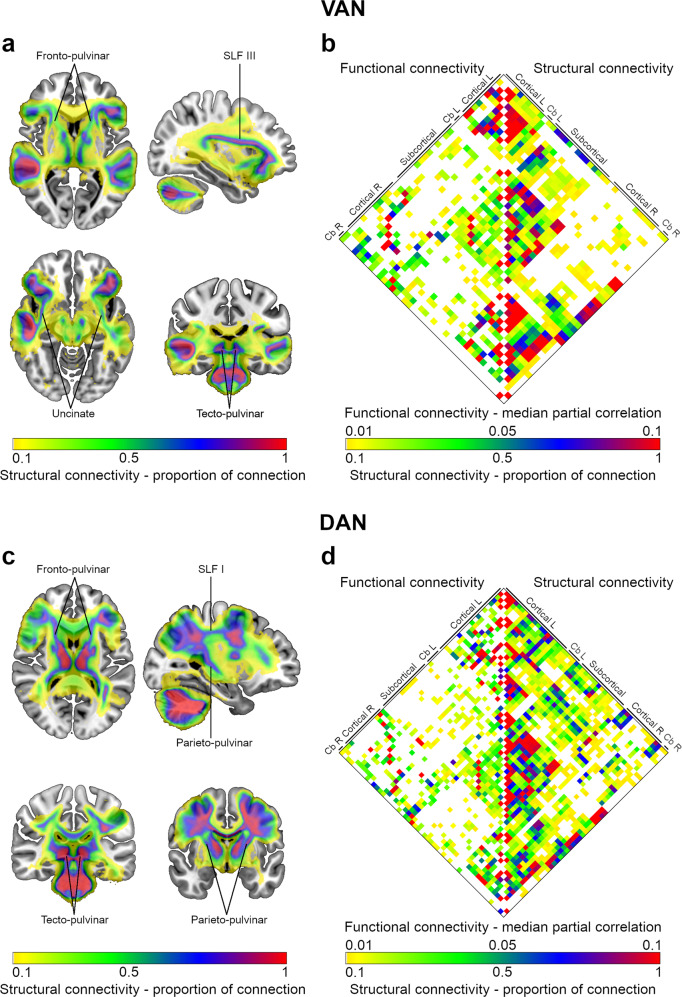
Fig. 3. Structural and functional connectivity of VAN and DAN nodes.
a Structural connectivity map of the VAN. b Matrix with the node-to-node functional and structural connectivity of the VAN, represented on the left and right halves, respectively. c Structural connectivity map of the DAN. d Matrix with the node-to-node functional and structural connectivity of the DAN, represented on the left and right halves, respectively. Nodes of the matrices were labeled in groups according to their anatomical location. A complete list with node labels is available in Supplementary Tables 1, 2. As indicated, color gradients represent the structural connectivity (expressed as the proportion of connection) or the functional connectivity (defined as the median partial correlation). Cb cerebellum, L left, R right, SLF superior longitudinal fasciculus.

