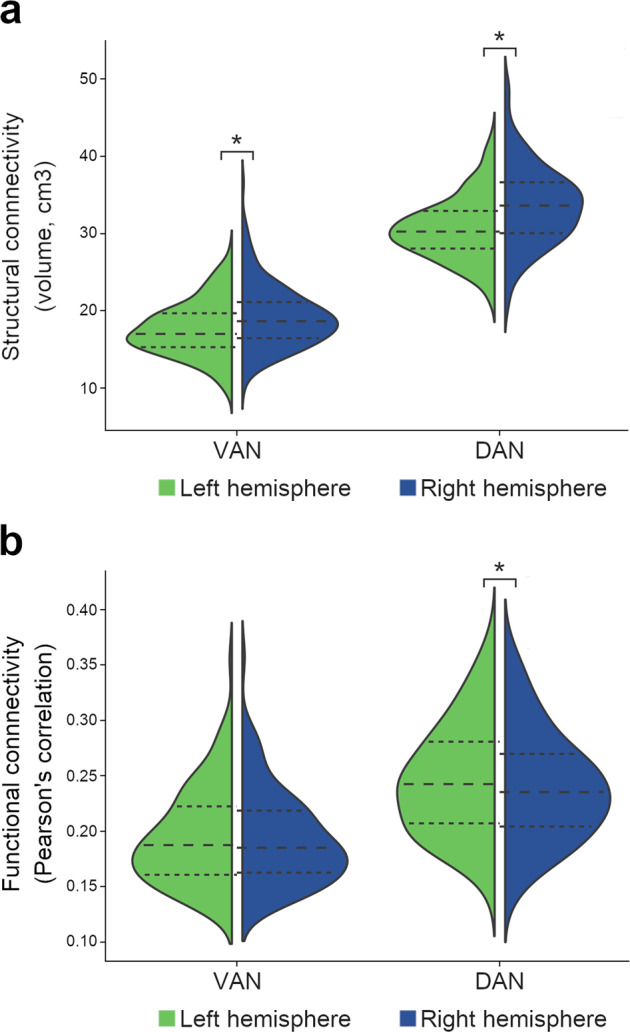
Fig. 4. VAN and DAN lateralization.

Structural connectivity is expressed in volumes of the structural connection maps (a) and functional connectivity in average Pearson’s correlations (b) across hemispheric nodes. Dashed lines represent the median and the interquartile range; the minimum and maximum correspond to the violin limits. DAN dorsal attention network, VAN ventral attention network. Asterisk (*), significant differences between the right and the left hemispheres (p < 0.05; paired analysis; structural connectivity, n = 177; functional connectivity, n = 110).
